Your count says units are missing. It does not say why. This guide defines retail shrink, shows the two ways to calculate it, and separates the loss that left the building from the loss that exists only in your records.
Retail shrink is the gap between the inventory your records say you hold and the inventory a physical count finds, usually shown as a percentage of sales. It comes from four causes: external theft, employee theft, process and administrative errors, and vendor fraud or error. In the last national survey, theft made up 65% of the total and process and control failures made up 27%. That 27% is the part that is not theft.
Most shrink guides treat the number as a theft number. That reading sends loss prevention budget at a problem that is partly paperwork. A receiving clerk who keys the wrong case count creates the same line in your shrink report as a shoplifter does, and no camera at the door will find it.
Phantom inventory is the effect on the record. Shrink is the loss behind it. This guide covers the loss side: how to define it, how to calculate it, what causes it, and how to tell the loss that left the building from the loss that exists only in your system. For the record side, read Phantom Inventory Explained.
NRF describes shrink as the losses a retailer calculates over a set period, expressed as a share of sales. Operations researchers describe the same gap in units: the difference between the quantity the inventory record says is on hand and the quantity physically there. One definition counts dollars and the other counts units. Both describe a computed number.
That detail matters. Nobody watches a unit disappear. The system subtracts a count from a record and labels the difference shrink. Every cause that makes the record wrong ends up in the same number as every cause that removes product.
Two formulas are in common use. They answer different questions and give different percentages for the same store.
The example below uses round numbers chosen for the arithmetic. They are not real data.
| Line | Amount at retail | How it is derived |
|---|---|---|
| Net retail sales | $10,000,000 | Given, 52 weeks |
| Beginning inventory | $1,500,000 | Given |
| Net receipts | $10,660,000 | Given |
| Recorded markdowns | $160,000 | Given |
| Book ending inventory | $2,000,000 | 1,500,000 + 10,660,000 − 10,000,000 − 160,000 |
| Physical count | $1,840,000 | Given, audited |
| Shrink value | $160,000 | 2,000,000 − 1,840,000 |
| Rate on sales | 1.60% | 160,000 ÷ 10,000,000 |
| Rate on book inventory | 8.00% | 160,000 ÷ 2,000,000 |
The same $160,000 is 1.60% of sales and 8.00% of book inventory. The book-basis rate looks larger because a store turns its stock many times a year, so ending inventory is small next to annual sales. Always state the denominator when you report a shrink rate, and never compare a sales-basis rate to a book-basis rate.
Shrink comes from four sources. Only two of them involve a person taking product.
| Cause | What it covers | What the count shows | Who can fix it |
|---|---|---|---|
| External theft | Shoplifting, organized retail crime, burglary, return fraud | Units gone, record unchanged | Loss prevention, store layout, security |
| Employee theft | Product diversion, register skimming, sweethearting, misuse of discounts | Units gone, often clustered by shift or location | Controls, audits, exception reports |
| Process and administrative error | Receiving miscounts, scan errors, wrong unit of measure, unrecorded damage and waste | Units may never have left. The record is wrong | Receiving discipline, cycle counts, cause codes |
| Vendor fraud and error | Short shipments, duplicate billing, delivery mistakes | Invoice says delivered, shelf never received it | Receiving checks, vendor scorecards |
The 2023 NRF survey, covering fiscal 2022, reported three shares: external theft at 36%, employee theft at 29%, and process and control failures at 27%. The rest was unknown or other loss. The 36% and 29% together are the 65% theft figure in the stats band.
These figures are estimates reported by retailers, not counted units. The respondents are loss prevention and asset protection teams, who see every theft case directly. A paperwork error leaves no case file. Treat the 27% as an estimate, not a count. That is our reading of who answers the survey. The survey itself does not say it.
Theft removes product without touching the record. The unit is gone and the system still shows it. This is the cause loss prevention programs are built for, and the evidence for it is strong. It is also the only cause where a camera, a tag, or a guard changes the outcome.
This cause is the one that does not involve a taker. A truck delivers 10 cases and the receiving record says 12. A cashier scans the wrong produce code. A damaged case goes into the dumpster with no adjustment. Each one creates a gap between the record and the shelf. At the next count the gap shows up as shrink, and nothing was stolen.
A vendor who ships short and bills in full creates the same gap, as does a duplicate invoice or a delivery to the wrong store. The fix sits at the receiving dock, with a count on arrival and a claim filed before the invoice is paid.
The strongest published evidence on how often records fail comes from Nicole DeHoratius and Ananth Raman. They audited 369,567 inventory records across 37 stores of one major department store chain and published the result in Management Science in 2008. They found that 65% of the records did not match the physical count.
One retailer and one set of stores is a limited sample, and the data is older. It does not give a current industry rate. It does show that record error is a normal condition of retail inventory and not a rare event. When the record is higher than the shelf, the next count books the difference as shrink. When the record is lower than the shelf, the count hides a real loss. Errors run in both directions and the count reports the net.
A count can confirm that a unit is missing from the record. It cannot confirm that anyone stole it.
This is the link between shrink and inventory accuracy. If you want the full treatment of the accuracy side, including the five measurement methods, read Retail Inventory Accuracy.
The last national shrink rate came from NRF’s 2023 National Retail Security Survey. It reported shrink of 1.6% of sales for fiscal 2022, about $112.1 billion, up from 1.4% and $93.9 billion the year before.
In October 2024, NRF said it would not publish its annual shrink report that year while it reevaluated how it tracks theft. Trade press reported the decision, and NRF has since published on theft and violence. No newer national shrink rate has replaced the 2022 figure.
If you cite an older figure, state the edition year and the fiscal year it covers. A shrink statistic with no year is not usable. For internal targets, rely on your own data: your count variance by department, store, and period, compared against your own history.
Operations teams use these three terms as if they were interchangeable. They answer different questions.
| Term | What it measures | Unit | Where it shows up |
|---|---|---|---|
| Retail shrink | Value lost between the record and the count | Dollars, or % of sales | The gross margin line after a physical count |
| Phantom inventory | Stock the system shows as available that is not on the shelf | Units | Empty shelves while the system says in stock, and replenishment that never fires |
| Inventory accuracy | How often the record matches the shelf | % of SKUs or locations with zero variance | A count or audit result |
The three are linked. A record error creates phantom inventory. Phantom inventory suppresses reorders and causes out-of-stocks, which you can read about in On-Shelf Availability Explained. The same record error shows up in the next count as shrink.
Many retailers reconcile book inventory against a full physical count once or twice a year. If you count once a year, a receiving error from January sits in the record until the count, up to twelve months later. Errors from different causes pile up in the same account in the meantime.
The count result is also a net dollar figure by store or department. It tells you the total gap. It does not tell you whether a shoplifter, an employee, a receiving clerk, or a vendor created it. Retailers then assign the total to causes using estimates, exception logs, and investigation results. That is how a record error ends up counted as theft in a survey.
More frequent counts shorten the lag. The methods for doing that without closing the store are covered in Retail Cycle Counting.
You will not get a clean split. You can get a better one than a single annual total.
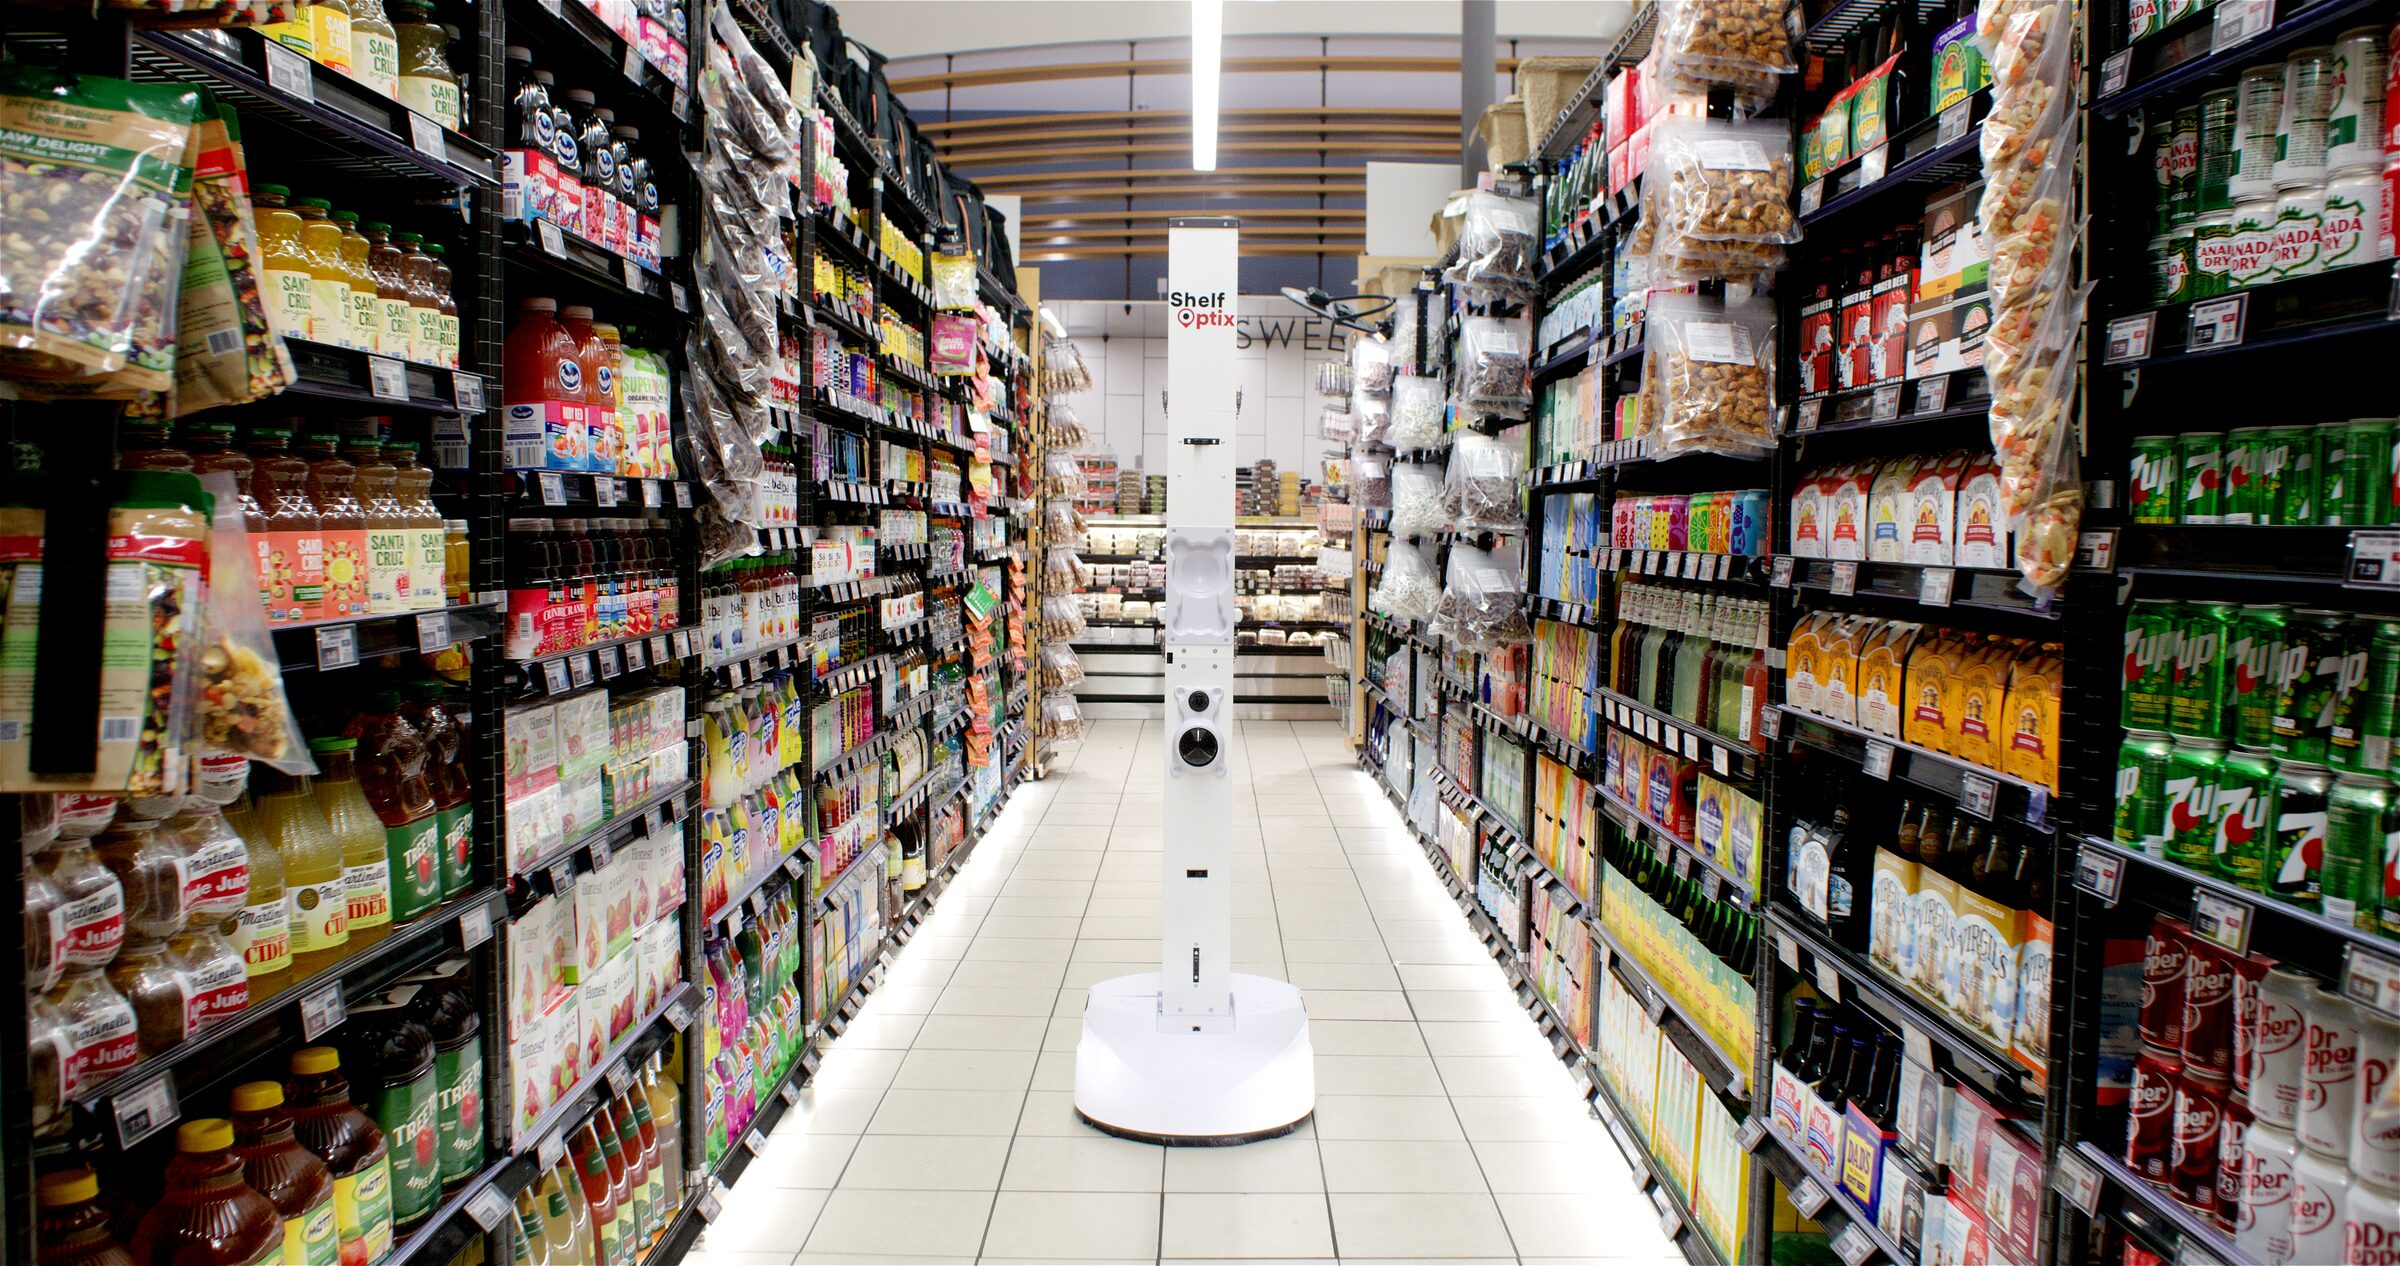
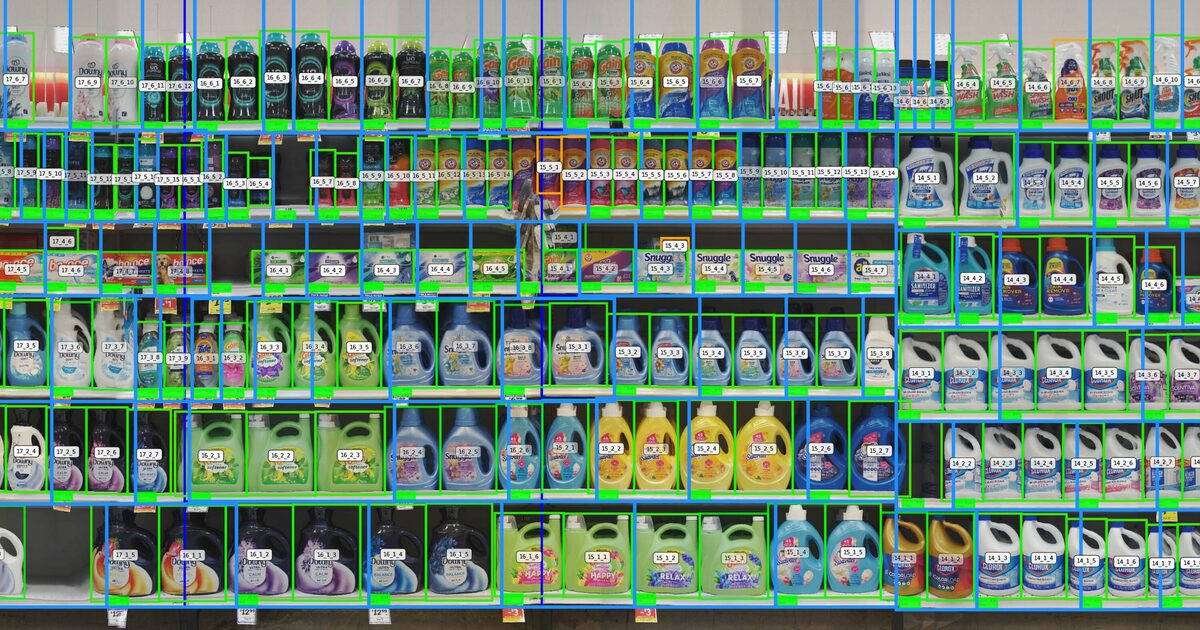
ShelfOptix does not run loss prevention cameras, tags, or guards, and it does not detect theft. It scans shelves on a managed schedule with a human-escorted robot and reports where the shelf and the system record disagree. That disagreement is the evidence you need to separate a record error from a physical loss.
A scan sees the front of the shelf. It does not see product behind the front facing, so pair it with counts for depth. The limits are covered in Why Shelf Computer Vision Degrades in a Live Store. For a framework to evaluate vendors on what they can and cannot see, read How to Evaluate a Shelf-Intelligence Vendor.
Retail shrink is the gap between the inventory your records say you hold and the inventory a physical count finds. It is usually reported as a percentage of sales. It comes from four causes: external theft, employee theft, process and administrative errors, and vendor fraud or error. Some of what appears as shrink is a record error, not a lost unit.
For benchmarks, divide the shrink value at retail by net retail sales and multiply by 100. For finance and warehouse reporting, subtract the physical count value from the book inventory value, divide by the book inventory value, and multiply by 100. The two rates use different denominators, so do not compare one to the other.
The last national figure NRF published was 1.6% of sales for fiscal 2022. NRF has not published a newer shrink rate, and no replacement national benchmark exists. Averages also hide large differences between departments, so compare your own stores to each other and to your own history before you compare them to a national number.
In the 2023 NRF survey, external theft made up 36% of shrink, employee theft 29%, and process and control failures 27%. The respondents were retailers reporting estimates, not counted units. Process errors leave no case file, so the 27% is an estimate of a loss that is hard to see. Treat it as a starting point for your own count data.
Shrink is the loss: the value that disappears between the record and the count. Phantom inventory is the effect on the record: stock the system shows as available that is not on the shelf. A theft or an unrecorded loss can create phantom inventory, and a record error can create both phantom inventory and apparent shrink.
In October 2024, NRF said it would not publish its annual shrink report that year while it reevaluated how it tracks theft. NRF later reported on theft and violence instead. The 2023 National Retail Security Survey, covering fiscal 2022, is the last edition with a national shrink rate.
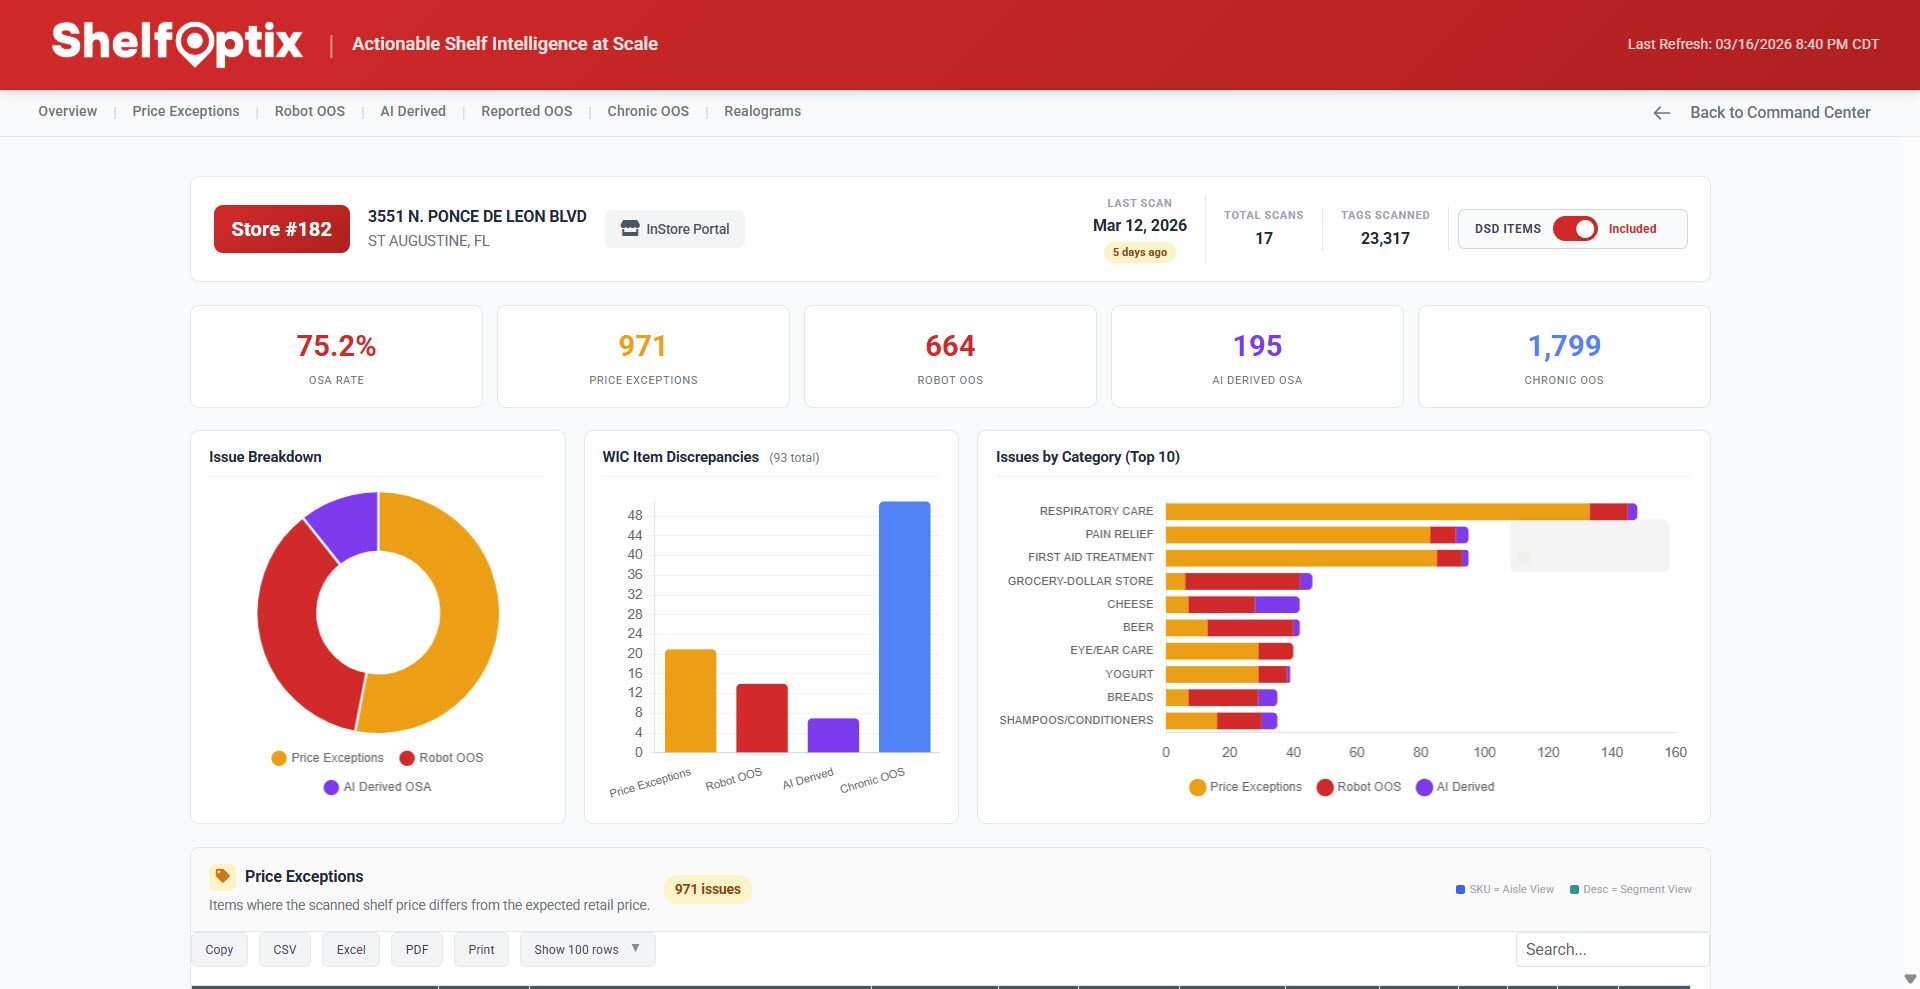
ShelfOptix scans your shelves on a managed schedule and shows you where the shelf and your record disagree, so you can tell a record error from a physical loss. Talk to the team about your count variance.
Thanks for reaching out. A member of the ShelfOptix™ team will be in touch with you right away.