Why your numbers look better than your shelves — and the five methods that actually fix it. The pillar guide to what store-level inventory accuracy really measures, how it differs from on-shelf availability, why the industry average sits near 63%, and how leading retailers close the gap at the shelf.

Most retail enterprises report store-level financial metrics showing 95%+ database consistency. The actual shelves tell a different story. According to canonical research from the Auburn University RFID Lab, average store-level inventory accuracy sits at roughly 63%. Best-in-class organizations running advanced tracking frameworks exceed 95%. The remaining majority of the market continues to bleed substantial revenue. Roughly 80% of the operational gap traces to phantom inventory — a silent execution failure where systems register stock as in stock that is physically missing from store shelves.
In a retail-shelf context, the physical count is the actual quantity of buyable inventory present on the active sales floor. The system count is the digital balance recorded in the enterprise perpetual inventory database.
Inventory accuracy is the metric that quantifies the exact unit-level correlation between physical stock present on store shelves and the corresponding digital records maintained in a retailer’s perpetual inventory system. Supply-chain and retail-ops leaders evaluate the metric through the system-count vs physical-count frame.
The system count is the theoretical stock ledger updated continuously by point-of-sale transactions, incoming shipments, and digital adjustments. The physical count is the absolute reality of what sits on the sales floor, immediately accessible to a shopper. When the two decouple — known in academic literature as Inventory Record Inaccuracy (IRA) — automated ordering algorithms fail, forecasts distort, and margin erodes.
To manage store-level inventory accuracy effectively, you have to be clear about what the metric is not.
Retailers also have to choose how they score the metric. Signed error calculates the net difference across all SKUs, allowing positive discrepancies (shelf exceeds system) to cancel out negative discrepancies (system exceeds shelf). It is useful for financial reporting because it balances overall asset value on the books. For operational execution, binary error is the version that matters. Binary error treats any variance — even a single missing or excess unit — as a total failure of record integrity. If a store has ten units of SKU A on the books but only nine on the shelf, that SKU is marked inaccurate. Binary variance is what disrupts automated ordering systems, delays replenishment, and creates empty shelf facings.
Confusing store-level inventory accuracy with on-shelf availability is the primary reason retail supply chains suffer from invisible margin degradation. This section is the analytical bridge between the boardroom KPI and the shelf KPI. If your executive leadership team manages store performance only on system-ledger accuracy, you will consistently fail to identify localized execution issues that drive shoppers away from your physical locations.
| Dimension | Inventory Accuracy | On-Shelf Availability (OSA) |
|---|---|---|
| What’s being measured | Exact quantitative correlation between physical units on hand and digital ledger units. | Physical presence of a product on the designated shelf facing in a buyable condition. |
| Who reads the KPI | CFOs, VP/SVP of Operations, Supply-Chain Directors, Category Planners. | Store Managers, Regional Directors, Brand Managers, Visual Merchandisers. |
| How it’s calculated | (Physical Count ÷ System Count) × 100. | % of active assorted SKUs physically present on the sales floor. |
| Where it lives in the stack | ERP, Warehouse Management Systems (WMS), Perpetual Inventory (PI) databases. | Shelf-monitoring systems, real-time computer-vision databases, in-store execution logs. |
| What it misses | The physical location of stock (e.g., whether it is on the shelf or lost in the backroom). | The absolute unit quantity and the financial value of inventory on the books. |
The commercial weight of this distinction grows as omnichannel fulfillment strategies like Buy Online Pick Up In Store (BOPIS) and Ship-From-Store become standard operational requirements. A high inventory accuracy KPI creates a false sense of security. If your IMS states that you have twelve units of a high-demand laundry detergent in stock, your automated replenishment system will not trigger a reorder. If those twelve units are trapped inside an unopened pallet in the backroom or misplaced in a seasonal display aisle, they are invisible to the shopper. Administratively your inventory accuracy is technically 100%. Your on-shelf availability is 0%.
The financial impact is severe. When customers encounter empty shelves, NielsenIQ research finds the majority will switch to a competitor or abandon the purchase — and a meaningful share permanently abandon the retail chain after a single out-of-stock experience. In a ship-from-store environment the cost compounds. When store associates have to search backroom clutter for items that are misplaced or missing, the search time eliminates fulfillment margin and introduces labor inefficiencies that ripple upstream.
Maintaining inventory precision across a complex physical retail network is one of the most persistent inventory accuracy challenges retail-industry leaders face. As operational errors accumulate daily, store-level inventory accuracy naturally degrades. Five primary operational failures drive most of the systemic gap.
Phantom inventory is the single most destructive driver of inventory drift — the digital database shows a positive stock balance while the physical shelf is bare. Modern automated replenishment systems rely on digital balances rather than physical visual verification. The system assumes the item is present and fails to reorder. Replenishment halts indefinitely, creating a permanent state of empty shelves that traditional database-driven tracking cannot detect.
Shoplifting, organized retail crime, employee theft, and unrecorded product damage or spoilage continuously erode inventory accuracy. If a bottle of premium olive oil is stolen or accidentally shattered on the floor, and the store team does not immediately scan it out of the system as a write-off, the database continues to display that unit as sellable. Over weeks and months, unrecorded shrink drives a measurable wedge between system records and physical reality.
Errors at the backroom dock introduce systemic inaccuracies before products ever reach the sales floor. When delivery trucks arrive, receiving clerks often scan one master carton barcode while physically unloading a different quantity or SKU. A distributor may ship the wrong flavor profile or size variant while the store team logs the shipment under the expected SKU. The perpetual inventory record is corrupted instantly, polluting automated forecasts downstream.
Under intense checkout pressure, cashiers often scan a single product barcode multiple times to process several related items. If a shopper purchases six different flavors of baby food, the cashier may scan a single jar six times to expedite the transaction. The financial total stays correct — but unit inventory on one flavor drops by six while the other five remain unadjusted in the system, degrading SKU-level inventory accuracy.
Even when correct inventory is physically present in the building, it is frequently trapped in the backroom receiving area, hidden in secondary display zones, or pushed to the back of deep shelving. Because associates spend hours searching backroom clutter rather than executing structured replenishment, the product remains unavailable to shoppers, driving down on-shelf availability despite positive system counts. Often referred to as the last-meter problem, this is the single most underestimated cause of store-level inventory inaccuracy.
To evaluate how to measure inventory accuracy and prevent systemic drift, you have to understand the operational trade-offs of the available tracking methodologies. Every method has an inherent accuracy ceiling, operational cadence, cost structure, and functional blind spot. Selecting the right framework depends on whether you need historical compliance or active real-time store execution.
| Method | Cadence | Accuracy ceiling | Cost | Blind spot |
|---|---|---|---|---|
| Cycle counting | Weekly to quarterly | ~85% | High operational labor | Captures only a narrow subset of SKUs per count. Human error is common as associates manually count identical packaging. |
| Annual physical inventory | Annual | ~90% at moment of audit | High financial & administrative | Static historical snapshot that degrades within days. Provides zero help for daily shelf execution. |
| POS-derived variance modeling | Continuous (algorithmic proxy) | ~75% | Low software-only | Relies purely on sales anomalies. Struggles to distinguish a physical out-of-stock from a localized drop in consumer interest. |
| RFID continuous reads | Continuous | 95–99% in select categories | High infrastructure & tag | Fails around liquids and metals due to signal absorption. Requires per-item tagging investment that prohibits store-wide deployment. |
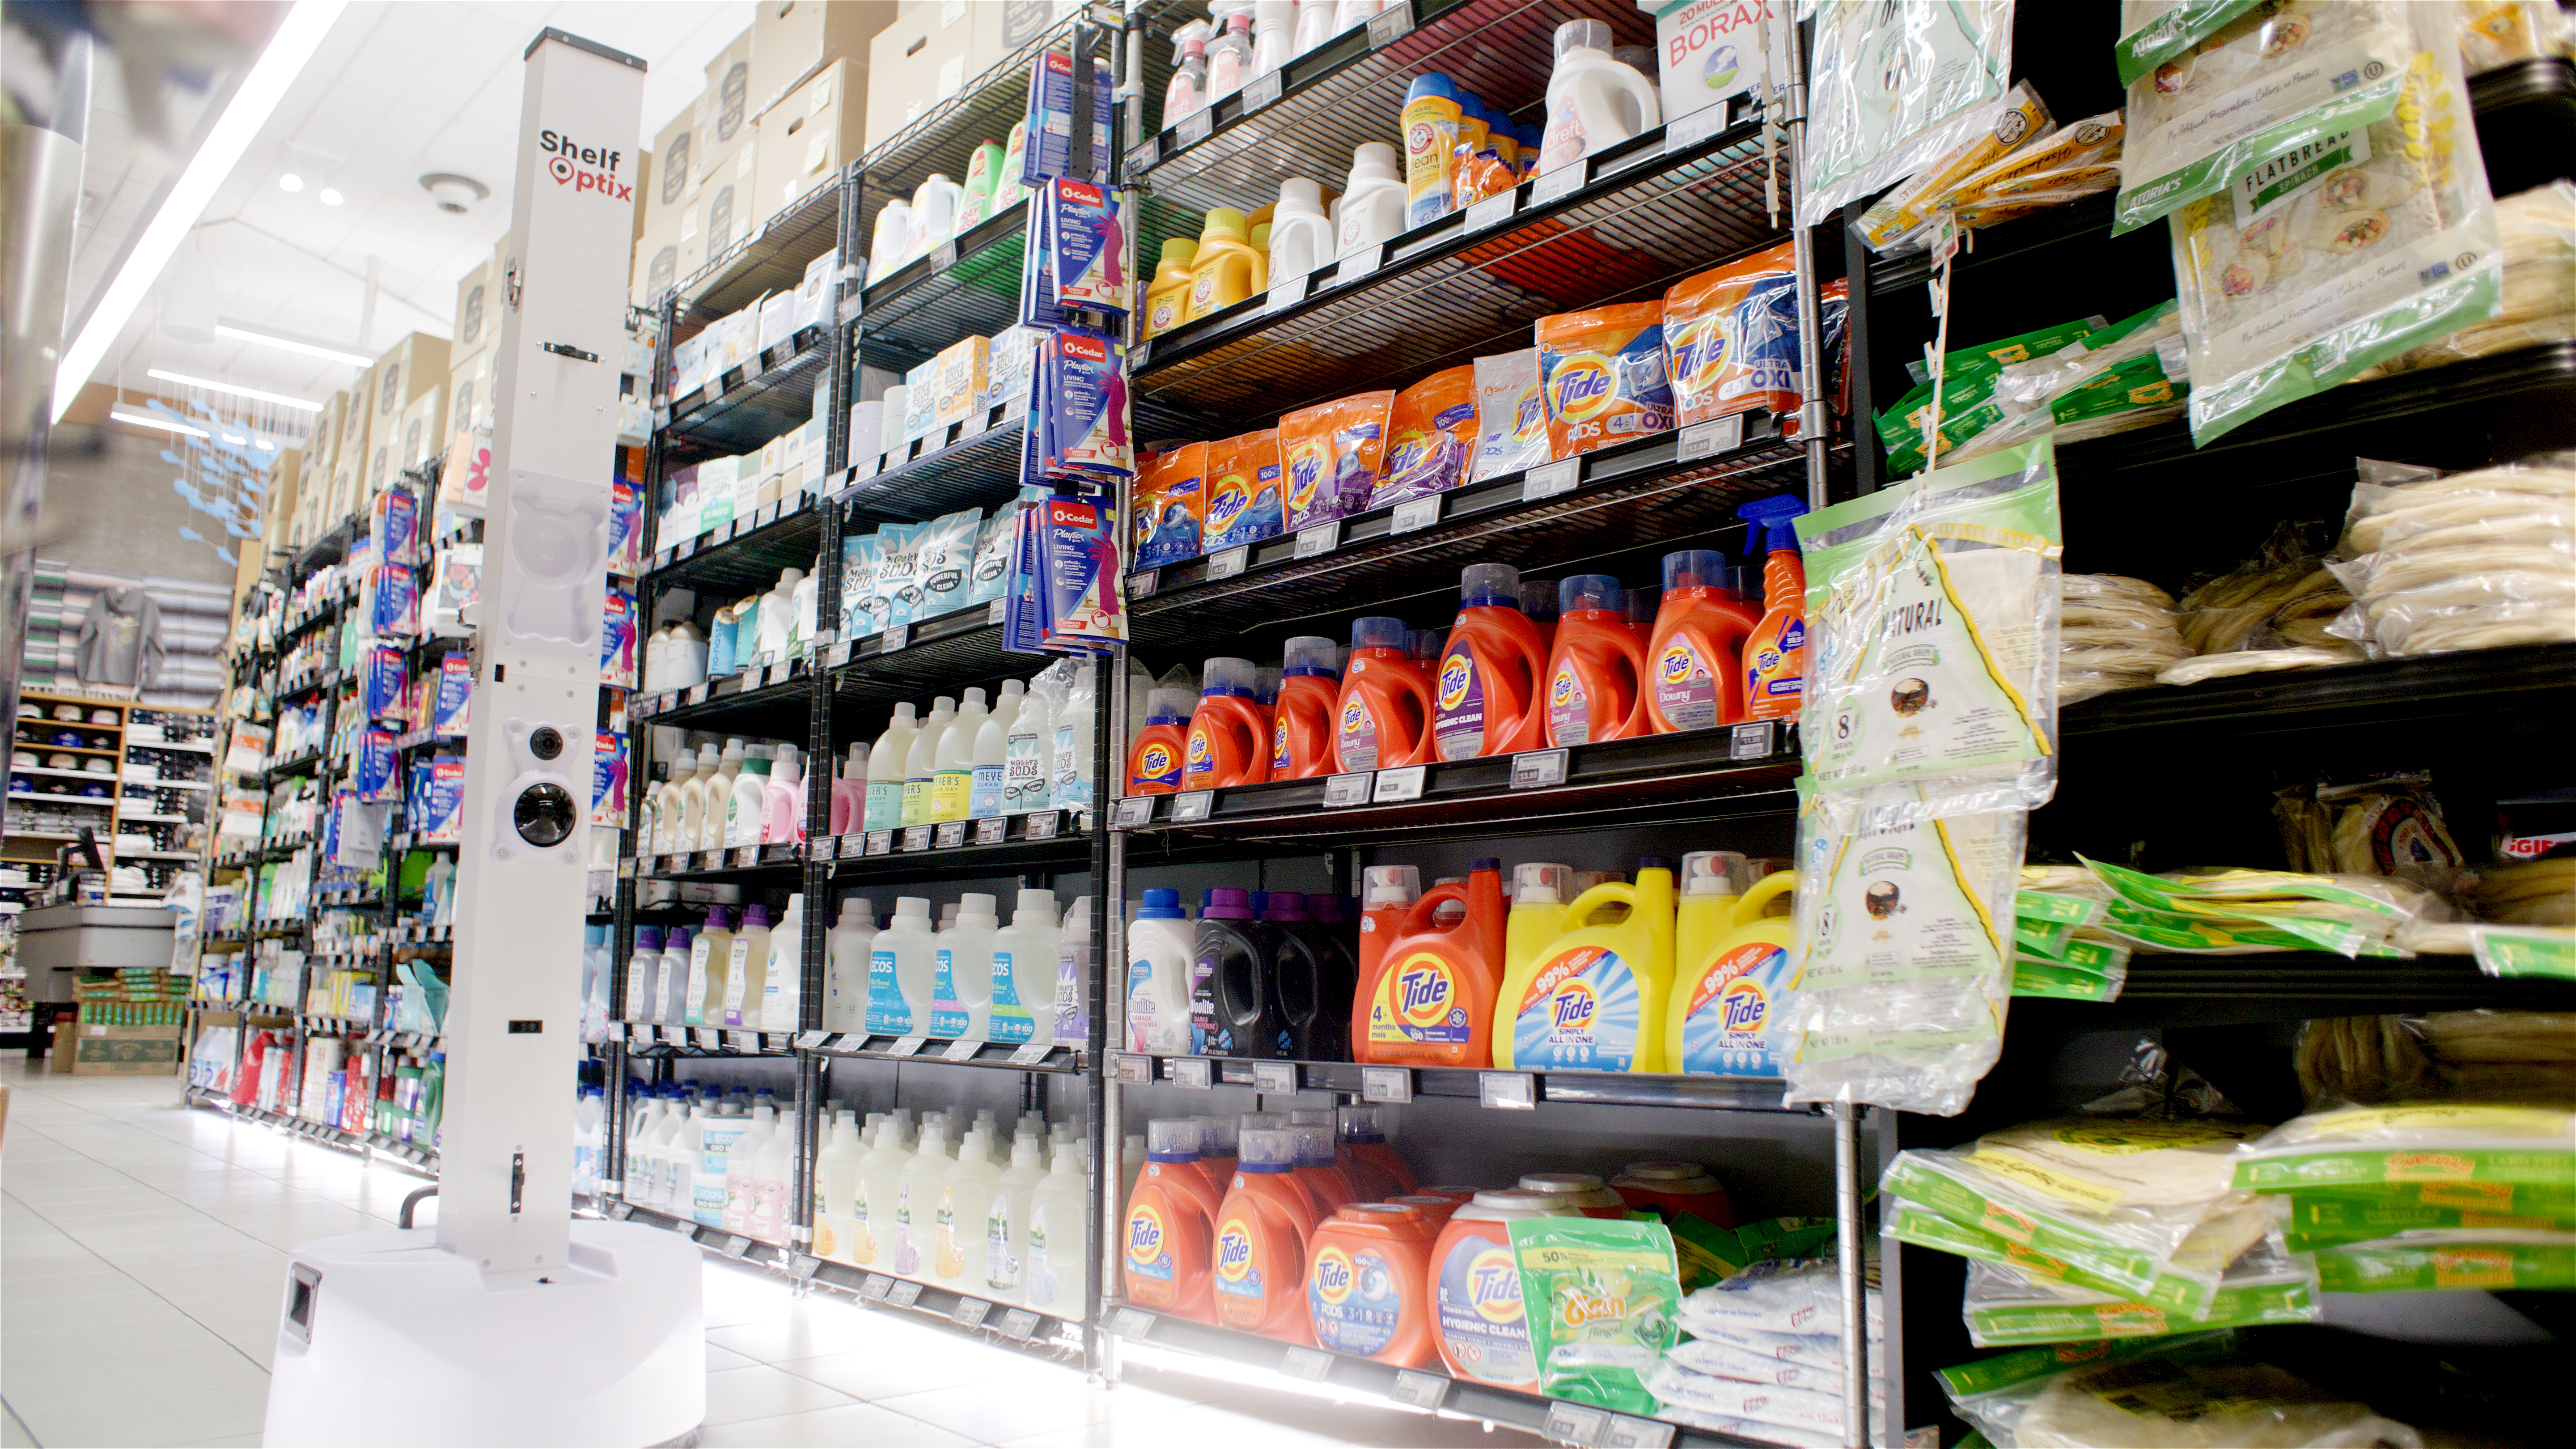
| Autonomous ground-truth shelf scanning | Continuous (daily automated scans) | ~98% of visible shelf inventory | Moderate operational (opex) | Cannot detect items pushed to the extreme back of deep shelves or sealed boxes stored in the backroom. ShelfOptix is a leading option in this category — portable autonomous robots capture ground-truth shelf data daily. |
Methodology accuracy ceilings compiled from Auburn University RFID Lab, ECR Retail Loss research, and Zebra Technologies’ annual shopper studies.
Across these methods, reliance on manual or static systems consistently yields poor results. Traditional cycle counting and annual audits don’t scale across thousands of SKUs and stores — they only capture a single point in time. RFID continuous reads work exceptionally well for apparel but are physically blocked by dense grocery packing, liquids, and metallic containers.
Forward-thinking retail enterprises are turning to autonomous ground-truth shelf scanning. The approach uses computer vision and automated mobile robotics to capture visual shelf conditions daily. By analyzing the actual shelf face, these systems instantly identify missing products, misplaced items, and pricing errors — bypassing the operational limitations of physical RFID tagging or manual store audits. Evaluating vendors in this category means comparing measurement methodology, store-format coverage, cadence, integration touchpoints, and total cost of ownership.
Many supply-chain executives assume the systems used to maintain 99%+ inventory accuracy in distribution centers transfer directly to physical stores. The assumption ignores the operational realities of retail store execution. A warehouse is a highly controlled, closed-loop logistical node. A retail store is an open, dynamic, public-access space.
Consider the scale: thousands of SKUs multiplied by hundreds of stores, with thousands of daily customer interactions. In a warehouse, every item is slotted, stored, picked, packed, and shipped by trained workers using strict WMS directed-work protocols. Products do not move unless a transaction is logged.
On the retail floor, customers continuously interact with products. They pick up items, change their minds, and place them on random shelves across the store. A package of ground beef left on a dry grocery shelf is a total loss. A single bottle of premium wine placed on the wrong rack is effectively lost until the next physical audit.
Warehouse-level tracking methodologies don’t scale to the store level either. In a warehouse, fixed RFID portals or automated pallet scans capture massive quantities of goods effortlessly. On the retail sales floor, installing overhead RFID hardware is financially prohibitive and logistically impractical for most categories. Continuous RFID tag reads face notable physics problems in a grocery or supermarket layout: liquids absorb radio-frequency signals and metals reflect them, which makes a standard inventory check on canned goods, sodas, or liquid detergents highly inaccurate. If you apply warehouse methodologies to manage store shelves, you ignore the continuous customer-driven entropy that degrades shelf-level inventory accuracy daily.
“Your digital perpetual inventory count and your physical shelf count are two different numbers. When retail systems say ‘in stock’ but the shelf is empty, the only number that matters to your shopper is the one they can physically see.”
To successfully execute a strategy on how to improve inventory accuracy, supply-chain and retail-ops leaders have to move away from retrospective auditing and transition to continuous visual verification. The four-step program below systematically raises store-level inventory accuracy by 10 or more percentage points and turns store data into a reliable source of operational truth.
You can’t manage what you don’t measure. Traditional inventory management fails because it relies on POS transaction data to infer shelf availability, completely missing phantom inventory. Retailers have to establish an objective, visual baseline of what is actually on store shelves. Applying our managed shelf-scanning service provides a highly precise automated visual audit of your physical shelf space, exposing hidden stock discrepancies and giving you a defensible ground-truth dataset.
With a baseline in place, analytics teams isolate the specific SKUs, categories, and store locations driving most of the inaccuracies. ECR Retail Loss research consistently shows that inventory drift is non-uniform — a small subset of high-value, high-velocity, or high-shrink items drives the vast majority of discrepancies. By isolating these “variance offenders,” you focus labor and audit resources where they deliver the highest financial impact.
Data is useless unless it drives physical execution. Once a shelf-intelligence system identifies a discrepancy — positive digital count but empty shelf facing — it has to instantly route a prioritized task to in-store associates. The closed-loop pattern directs employees to exact shelf coordinates, prompting them to replenish from the backroom or correct the system balance immediately. The result is the elimination of wasted labor hours spent searching for non-existent stock.
The final step is to measure the direct financial impact of accuracy improvements. When you reconcile inventory records and eliminate phantom stock, automated replenishment systems begin to operate effectively again. Field research from the ECR Retail Loss Group shows that correcting store-level inventory records produces measurable sales lift in the 4–8% band. Tracking the lift lets you prove the financial ROI of inventory accuracy initiatives directly to the CFO.
Inventory accuracy is the metric that quantifies the exact unit-level correlation between physical stock present on store shelves and the digital records in a retailer’s perpetual inventory database. It is measured by physically counting active shelf inventory and comparing it against the system count, expressed as a percentage.
The inventory accuracy formula is calculated by dividing the physical count of units on store shelves by the digital system count, then multiplying the result by 100: Inventory Accuracy (%) = (Physical Count ÷ System Count) × 100. It serves as the key indicator of data integrity between the perpetual inventory file and the sales floor.
Replace infrequent manual audits with continuous visual shelf monitoring. Establish an objective ground-truth baseline of the shelf, identify high-variance SKUs and locations, route targeted exception alerts to store associates, and align records before out-of-stocks impact sales. Track resulting category sales lift to defend the program ROI.
Inventory accuracy measures the exact quantitative correlation between physical units on hand and digital records. On-shelf availability measures whether a product is physically present on its designated shelf facing in a buyable condition. A store can have a perfectly accurate count of zero while suffering from 0% on-shelf availability — the two metrics measure different things.
Store-level accuracy is lower because stores are open, public environments where shoppers continuously move, misplace, or remove inventory. Warehouses are closed, highly regulated spaces with linear workflows, controlled handling, and standardized slotting, which naturally minimizes human error and physical drift.
Modern technology enhances accuracy by replacing manual processes with automated shelf intelligence. Using computer vision and autonomous robotics, retailers can capture real-time shelf conditions, identify phantom inventory, and direct store associates to corrective action with exact shelf-coordinate data.
An inventory accuracy KPI evaluates the percentage of checked SKUs where the physical count exactly matches the digital system count. A variance of even one unit is classified as inaccurate under binary error scoring, which helps retailers identify systemic receiving, POS checkout, or shrink failures.
Closing the inventory accuracy gap takes more than another cycle count. By establishing an automated, high-frequency baseline of physical shelf reality, retail and CPG leaders can bridge the system-vs-shelf gap, restore forecasting integrity, and reclaim lost revenue. ShelfOptix delivers managed ground-truth visibility at scale — no capital investment, no store labor.
Thanks for reaching out. A member of the ShelfOptix™ team will be in touch with you right away.