The demo hit its number. The pilot did not. Six physical mechanisms explain the gap, and they split into three types that need three different fixes. Only one type is a model problem. This piece names each cause, shows how to measure it in your own stores, and matches the fix to the cause.
Shelf computer vision loses accuracy in a live store because the system fails in one of three ways, and each way has a different fix. View causes (occlusion, shelf depth, camera angle) mean the camera never captured the evidence. Appearance causes (lighting, SKU churn) mean the camera captured it and the model did not recognize it. The reference cause (planogram drift) means the system read the shelf correctly and scored it against an out-of-date plan. A better model helps with the second type at most.
Our pillar piece named six reasons detection coverage slips in a live store and said none of them are solved by a better model alone. Our ROI piece then told you to discount recovered value by an effective detection rate below 100 percent. Both pieces left two questions open. Why does each mechanism happen, and how do you find your own rate? This piece answers both.
If your pilot scored lower than the vendor demo, you are not the first buyer to see it, and the cause is rarely carelessness on either side. A demo and a store are different measurement conditions. The sections below separate them.
A demo controls the variables that a live store does not. The images are captured at a good angle, at close range, under steady light. The products on the shelf are ones the model was trained on. The plan the scan is compared against is the plan on the shelf. Under those conditions, the detection benchmarks in the research literature are a fair guide to what the system can do.
A live store changes every one of those conditions. The camera gets one pass per visit, not a posed shot. A hanging bag covers the facing behind it. Light from the front windows is different at 8 a.m. and 6 p.m. A supplier changes packaging in the middle of a quarter. A reset moves forty facings on Tuesday and the plan file updates on Friday. None of this is a defect in the vendor’s model. It is the difference between measuring a system and measuring a system in a store.
The practical consequence is that a single accuracy percentage tells you very little. A system can score well on every image it captures cleanly and still miss a large share of the facings in the store, because the misses happen before the model runs or after it finishes.
The six mechanisms group by where in the pipeline the failure occurs. The five-stage pipeline runs capture, detect, classify, compare, exception. View causes break stage one. Appearance causes break stages two and three. The reference cause breaks stage four. That grouping is what decides the fix.
| Cause | What happens | Type | What fixes it |
|---|---|---|---|
| Occlusion | One product, hanging bag, or shelf tag hides another | View | Capture angle and distance, a second pass, a handling rule for hanging items |
| Shelf depth | Product behind the front facing is invisible, so an empty row can look full | View | A different data source for depth, such as a count or a cycle audit. A camera in front of the shelf cannot supply it |
| Camera angle | An oblique view foreshortens the products that look most alike | View | Capture square to the fixture at a fixed distance |
| Lighting | Glare, shadow, and color shift change how a package looks | Appearance | Controlled or onboard capture lighting, training images from varied light |
| SKU churn | New packaging arrives before the model has been retrained on it | Appearance | A retraining cadence tied to the supplier’s packaging changes |
| Planogram drift | The shelf is scored against a plan version that is out of date | Reference | Keep the comparison plan current. Track which version each scan used |
The “what fixes it” column is the part most vendor guides leave out. Only the two appearance rows are problems a better model can address, and even those depend on capture quality and retraining discipline. The other four are solved by where the camera sits, how it is operated, or how current the data around it is.
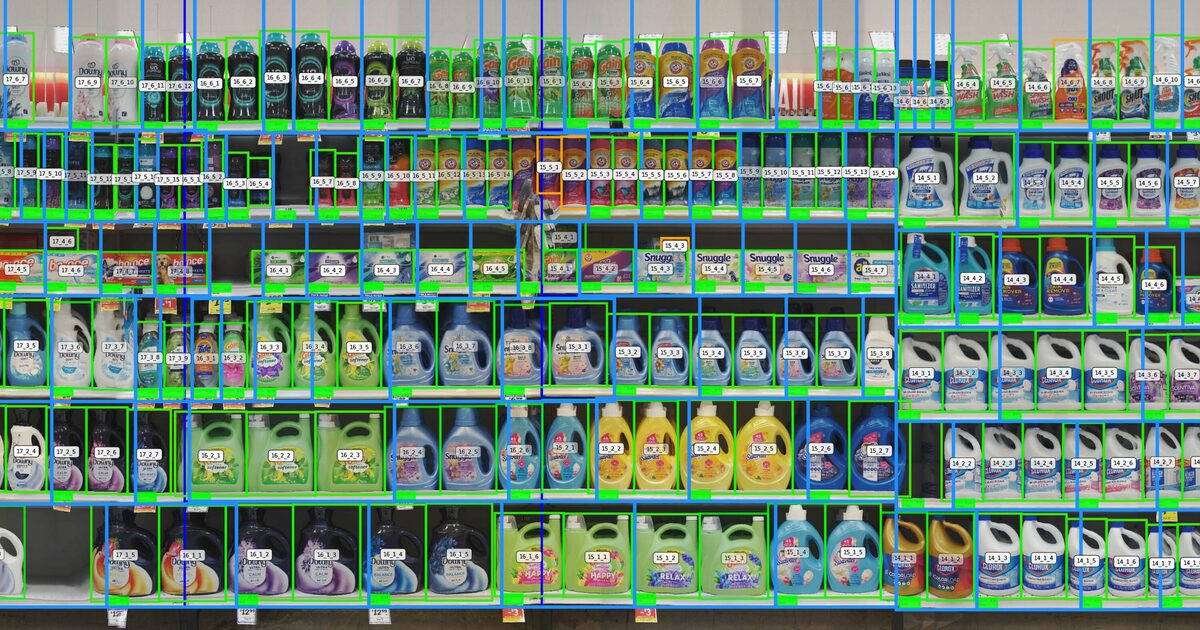
Shelves are among the densest scenes in computer vision. The SKU-110K benchmark averages 147 objects per image, with identical products placed edge to edge. Hanging bags, clip strips, shelf talkers, and tags add layers in front of the facings. When a facing is half covered, the system has to decide whether the visible half is the whole product. When it is fully covered, the system sees nothing and often reads that as a gap or as the neighbor’s product.
Occlusion is a capture problem. A second pass from a different position can recover some of it. A handling rule for hanging items can recover more. A larger model cannot recover a facing that no pixel in the image shows.
A camera in front of a shelf sees the front facing and nothing behind it. A row that holds one unit at the front looks the same as a row that holds twelve. The reverse is also true: an empty front slot can sit in front of product that has been pushed back. This is why a shelf scan and an inventory count answer different questions. The scan reports what the shopper sees. The count reports what is on hand. When the two disagree, you are often looking at phantom inventory or a facing that needs to be pulled forward.
No amount of model work changes this. The fix is to pair the scan with a data source that sees depth, which is the job of a disciplined cycle count.
A camera that is not square to the shelf sees each package at a slant. Products that differ only by a size marking or a color band on the side look even more alike when foreshortened. This is the same problem a human has reading a shelf tag from across the aisle. Distance and angle set the resolution of the detail the model needs. A ceiling camera and a close-range robot do not see the same pixels from the same shelf, which is the point of the camera placement table in the pillar piece.
Retail lighting is not designed for cameras. Glare on shrink-wrap, shadow under an upper shelf, and a color shift between daylight and store lamps all change the pixels the model receives for the same package. A model trained on images from one light condition will score lower on another. This is a real model-side problem, and it has a model-side fix: training images that cover the range of light the store produces. It also has a capture-side fix, which is to control the light at the moment of capture instead of relying on the store.
Packaging changes constantly. A seasonal wrap, a redesigned label, a new size, or a promotional pack can look different enough from the trained image that the model returns a low-confidence match or a wrong one. The failure grows with time since the last retraining. A system that was accurate at launch drifts as packaging changes around it. The fix is a retraining cadence tied to how often your categories change, and a process for getting new packaging in front of the model before the product reaches the shelf.
A model cannot score a facing the camera never saw.
Planogram drift is different from the other five because it does not involve a detection error at all. The system captured the shelf, recognized every product, and reported the layout correctly. It then compared that layout to a plan that no longer matched what the team set during the last reset. The result is a precise list of exceptions that are not exceptions. The shelf is right and the reference is wrong.
Treat this as a detection problem only in the narrow sense that it produces false exceptions. The cause of the stale plan sits upstream, in how plans are released and how resets are executed. We cover that mechanism in Reset Decay, and the software categories that handle plan versions in Planogram Compliance Software. For this piece the rule is simple: ask which plan version every scan was scored against, and keep that record.
Model quality matters. A stronger model recognizes more packaging variants, handles glare better, and separates similar products with more confidence. That moves the two appearance rows in the table above. It does not move the other four. A model works on the image it is given and the plan it is told to use. If the image lacks the facing, or the plan is wrong, model quality changes nothing about the outcome.
This is why buyers who focus a vendor evaluation on model accuracy often find the pilot disappointing. They tested the part of the system that was already strong. The questions that decide results in the field are about capture and data: how close, at what angle, how often, under what light, scored against which plan version, retrained how frequently. Add these to the accuracy criteria in How to Evaluate a Shelf-Intelligence Vendor.
Effective detection rate is the share of facings that the system both captured and scored correctly against the active plan. It is a working measure, not a published industry standard, and no independent benchmark of it exists for live stores. That makes your own audit the number of record. The ROI piece told you to apply this rate as a discount to recovered value. This is how to get it.
The miss labels map directly to the three types. A large share labeled “camera could not see it” points to capture protocol and placement. A large share labeled “model did not recognize it” points to lighting and retraining. A large share labeled “wrong plan version” points to how plans are released. Without the labels you have a rate and no direction.
Once you know which type dominates your misses, the fix list is short.
A managed program can control the variables a buyer can control: the route, the visit cadence, the capture protocol, and which plan version each scan is scored against. That is the design of ShelfOptix’s managed scanning service. It does not remove hanging bags, and it does not see product stacked two deep. Fixtures outside standard aisle shelving, such as end caps and dump bins, sit outside the robot’s reach too. A vendor that tells you what its system cannot see is giving you the information you need to plan around it.
Because a live store removes the controls a demo has. A demo captures clean images at good angles under steady light against a current plan. A live store gives the camera one pass per visit, products hidden behind hanging bags and other facings, lighting that changes through the day, packaging the model has not seen, and a planogram that a reset may have replaced. Six specific mechanisms account for most of the loss: occlusion, shelf depth, camera angle, lighting, SKU churn, and planogram drift. Only some of them are model problems.
Most misses come from the view causes. Occlusion hides a gap behind a hanging bag or a neighboring product, shelf depth hides what sits behind the front facing so an empty row can look stocked, and a camera angle that is not square to the shelf foreshortens the products it needs to tell apart. In each case the camera never captured the evidence, so no model can score it. A second group of misses comes from the reference cause: the scan is compared against a plan that is out of date.
The usual reason is that the pilot tested the system under store conditions the demo avoided. Check three things in order. First, whether the pilot stores were scanned at the angle, distance, and cadence the demo assumed. Second, whether the products on the shelf included new or changed packaging the model had not been retrained on. Third, whether the plan version the scan was scored against matched what was actually set on the shelf. Each one shows up as a different kind of miss, which is why a cause-by-cause audit is more useful than a single accuracy number.
Run a manual audit of a sample of facings on the same day as a scan, then label every facing as correctly scored, missed because the camera could not see it, missed because the model did not recognize it, or scored against the wrong plan. Divide correctly scored facings by the facings that were due to be scored. That share is your effective detection rate. The cause labels tell you which fix applies. Published research does not set a standard benchmark for this rate in live stores, so treat your own audit as the number of record.
Only partly. A better model helps with the appearance causes, lighting variation and unfamiliar packaging, although it still depends on retraining as packaging changes. It cannot score a facing the camera never captured, which is the case for the view causes, and it cannot correct a comparison against an outdated plan, which is the reference cause. Detection benchmarks on curated images are mature. The remaining gap in live stores comes from capture conditions and plan currency.
Walk through your pilot results with the ShelfOptix team. We will help you sort the misses into view, appearance, and reference causes, and show you what a managed scanning program does about each.
Thanks for reaching out. A member of the ShelfOptix™ team will be in touch with you right away.