Compliance peaks the day the reset is finished. What follows isn’t random decay — it’s a process signature. Here are the five events that move a facing off plan, what the research actually establishes about drift, and why your audit cadence is the variable that matters most.
Reset decay is the decline in planogram compliance that begins the moment a planogram reset is completed and continues until the next correction. It is driven by ordinary store operations rather than by any single failure — and because it is driven by process, it is predictable, store-specific, and measurable.
The reset is the part of the process everybody watches. Crews are scheduled, sections are stripped and rebuilt, tags are printed, and someone signs off that the store executed the plan. Then everyone leaves, and the shelf begins a slow, quiet return to something other than the plan.
That period — from the moment the crew walks out to the moment somebody next looks — is where most of the value of a reset is either kept or lost. It is also the period almost nobody measures. This guide covers what a planogram reset actually is, why compliance falls afterward, the five events that move a single facing off plan, and how to set an audit cadence that matches how fast your shelves really change.
A planogram reset is the physical rebuild of a shelf section to match a new or revised planogram. It is triggered by a range review, a seasonal transition, a new-item cut-in, or a remodel. A crew strips the section, rebuilds it to plan, and re-tags it.
Two things about resets are consistently misunderstood, and both matter for what happens afterward.
The planning cycle is far longer than the execution window. A category reset is typically locked months before it reaches a shelf — space plans are finalized, negotiated, and distributed while the store is still selling last cycle’s assortment. The build itself is compressed into days, often overnight, and frequently handled by specialist category reset teams brought in for the project. The plan is slow and deliberate; the execution is fast. And once the crew moves on to the next store, nothing is watching that shelf at all.
Reset cadence is per-category, not per-store. Retailers review categories on separate calendars — some twice a year, some annually, some only once every few years. The practical consequence is that no store is ever “between resets.” At any given moment a store is fresh in some categories, months stale in others, and mid-transition in a few. A single chain-level compliance number averages across all of those states and tells you very little about any of them.
So the compliance clock does not start chain-wide. It starts per section, on the day that section was last touched — which is why a meaningful compliance program has to know not just the score but the age of the score.
The intuitive story about post-reset drift is that shoppers slowly disorder the shelf — that decay is essentially entropy, roughly the same everywhere, and largely outside anybody’s control. The research does not support that story.
The most useful evidence comes from a study of retail execution published in California Management Review, in which researchers audited 242 stores of a large chain. Three findings reframe the problem:
The same work identified what actually predicts a store’s drift rate — SKU density, depth of inventory per SKU, part-time employee turnover, and general manager turnover. Newer associates are less likely to know that an item sold out on the floor is available in the back; stores that lost a manager during the year showed more misplaced items. In one telling case, a store that had its backroom capacity expanded showed worse performance the following year, because more storage meant more product stranded off the floor.
Read together, that is a definition of reset decay far more useful than a percentage: the rate at which a store drifts off plan is a property of that store’s operating process. It is a signature. Two stores in the same chain, resetting the same category on the same day, will not be in the same place six weeks later — and the difference between them is legible if you measure it.
“A reset isn’t a finish line. It’s the moment a measurable process starts running — and every store runs it at a different speed.”
Drift is not one failure. It is the accumulation of five recurring events, each of which is individually reasonable and none of which anybody records. Four of the five were identified as primary causes of shelf out-of-stocks in the industry’s most thorough study of the problem — a Procter & Gamble-funded research programme supported by GMA, FMI and NACDS.
Backstock never reaches the shelf, or lands one position off. Driven by stocking labor availability and training — and made worse, not better, by a fuller backroom.
An empty facing gets filled with a neighboring product. The shelf looks full, the gap becomes invisible, and a visual audit will score it compliant.
Product is pulled to a secondary display or endcap. The item now lives in two locations — available in one, bare in the other, in stock according to the system.
The planogram still calls for an item the store no longer carries, or a UPC that changed. Item-file hygiene fails quietly and the plan asks for something unbuildable.
The shelf tag no longer matches the product behind it. A 2025 field investigation of 26 US grocery stores found more than 150 expired or misleading tags, roughly a third of them outdated by ten days or more.
No single event is a violation. Compounded across weeks, they are the difference between the shelf you designed and the shelf your shopper stands in front of.
Event 02 deserves particular attention, because it is the one that corrupts the measurement as well as the shelf. When a hole is filled with a neighboring item and the tag is gone, the out-of-stock cannot be identified at all. When the wrong item sits under a correct tag, a visual auditor relying on a full-looking shelf will miss it. Phantom inventory and hole-covering are the same problem viewed from two directions: the shelf reports health it does not have.
The encouraging finding from the same research is how tractable this is. Enforcing three basic item-management practices — not covering holes, not hiding product, and keeping shelf tags accurate — reduced out-of-stocks by roughly 40%. Most retailers already have policies covering all three. The failure is not policy. It is that nobody is looking often enough to know whether the policies are being followed.
If you search for how fast planogram compliance falls, you will find a specific and confident answer: roughly ten percent per week. It appears across vendor blogs, checklist apps, industry explainers, and increasingly in AI-generated summaries, usually attributed to a trade-association study.
That figure has no traceable source study behind it. There is no published research that measures a planogram decay curve — not the rate, not the shape, not how it varies by category or format. The number has circulated long enough to sound like a finding, but nobody has published the measurement.
We think that is worth saying plainly rather than repeating, for three reasons. A number nobody measured cannot be used to plan an audit cadence. A single chain-wide rate contradicts the best available evidence, which shows drift varying by a factor of fifty between stores in the same chain. And a company that sells shelf measurement should not quote a number it cannot stand behind. So here is ours — measured, not inherited.
Across the shelves ShelfOptix scans, compliance measured at the facing level after a reset consistently lands well below the 90%-plus targets category teams plan against — and it keeps moving. Sections we scan repeatedly show a downward slope between resets rather than a stable plateau. In the sections we track most closely, that slope runs at roughly 10% of facings drifting off plan per week in the period following a reset — with the steepness varying substantially store to store, within the same chain and the same category.
That is a ShelfOptix observation from continuous scanning, not an industry benchmark, and we label it as such. It happens to land close to the figure that circulates unsourced — but we arrived at it by measuring the same shelves repeatedly, which is the only way the number means anything. And the average is the least interesting part: the spread between your best and worst stores is where the money is. The rate that matters for your business is not ours. It is the slope your own stores produce, which becomes knowable the moment the same shelf is measured more than once.
What is established is the relationship between compliance and availability: research found that a 10-point change in planogram compliance moved out-of-stocks by about 1 point. That study also carried a caveat the vendor literature routinely drops — for retailers already sustaining compliance above roughly 90%, the marginal return on further compliance work is low. Compliance effort pays where compliance is poor. Knowing which of your stores those are is the entire problem.
If drift is a per-store process running at a per-store speed, then the single most consequential decision in a compliance program is not the scoring rule. It is how often you look.
The audit method most chains rely on was designed for a different question. Sample-based manual audits have well-documented structural biases: the categories chosen are often influenced by whichever supplier is funding the audit; the timing frequently misses peak hours and weekends, and is often performed first thing in the morning when shelves have just been restocked; the observation window is too short to capture normal daily and weekly variation; auditor fatigue introduces error; and, as noted above, hole-covering makes some out-of-stocks structurally invisible to visual inspection. The researchers who catalogued those limitations concluded that manual auditing is not feasibly scalable across many categories and many stores.
None of which means auditing does not work. It works well — the problem is frequency. A randomized field experiment at a national retailer found that items subject to external audit were markedly less healthier than their controls on both dimensions at once: control-group items were 6.6 times more likely to show a shelf out-of-stock together with an inaccurate inventory record, and audited items produced a meaningful daily sales uplift. The authors found the audits economically viable in steady state, not just as a one-off intervention. A separate finding from the store-audit literature makes the same point from the other direction: stores counted twice a year had substantially lower error rates than stores counted once.
Counting causes compliance. The question is simply whether you are counting on a cycle that can see the shelf change.
| If your cadence is… | What you can see | What you cannot see |
|---|---|---|
| Annual / semi-annual | Whether a store is broadly executing at all. | Everything operational. By the time you measure, the section has been reset again. |
| Quarterly | Coarse store ranking; the worst outliers. | The slope. One point per quarter cannot distinguish a store that decayed fast and was fixed from one that decayed slowly. |
| Monthly | Direction of travel per store; a usable ranking. | Cause. You know which stores drift, not which of the five events is driving it. |
| Continuous / scheduled scan | The curve itself — per store, per section, per facing, with the event type attached. | Requires a scanning platform rather than store labor. |
The practical test is simple. If your stores drift meaningfully within six weeks and you audit quarterly, your compliance report is a historical document. It describes a shelf that no longer exists, and it cannot tell you whether the store is drifting or whether the planogram version it was scored against was simply out of date — the range-review lag problem covered in the compliance pillar guide.
Cadence is also the line that separates the software categories. A field execution app reports a visit, photo recognition scores whatever was photographed on that visit, and continuous scanning measures the shelf whether or not anyone went — which is why the cadence you need largely decides the category you should be shopping in. The planogram compliance software category map covers what each of the four types can and cannot see.
Everything above converges on one requirement. A compliance number captured once is a point. Reset decay is a slope. You cannot infer the second from the first, no matter how accurate the measurement is.
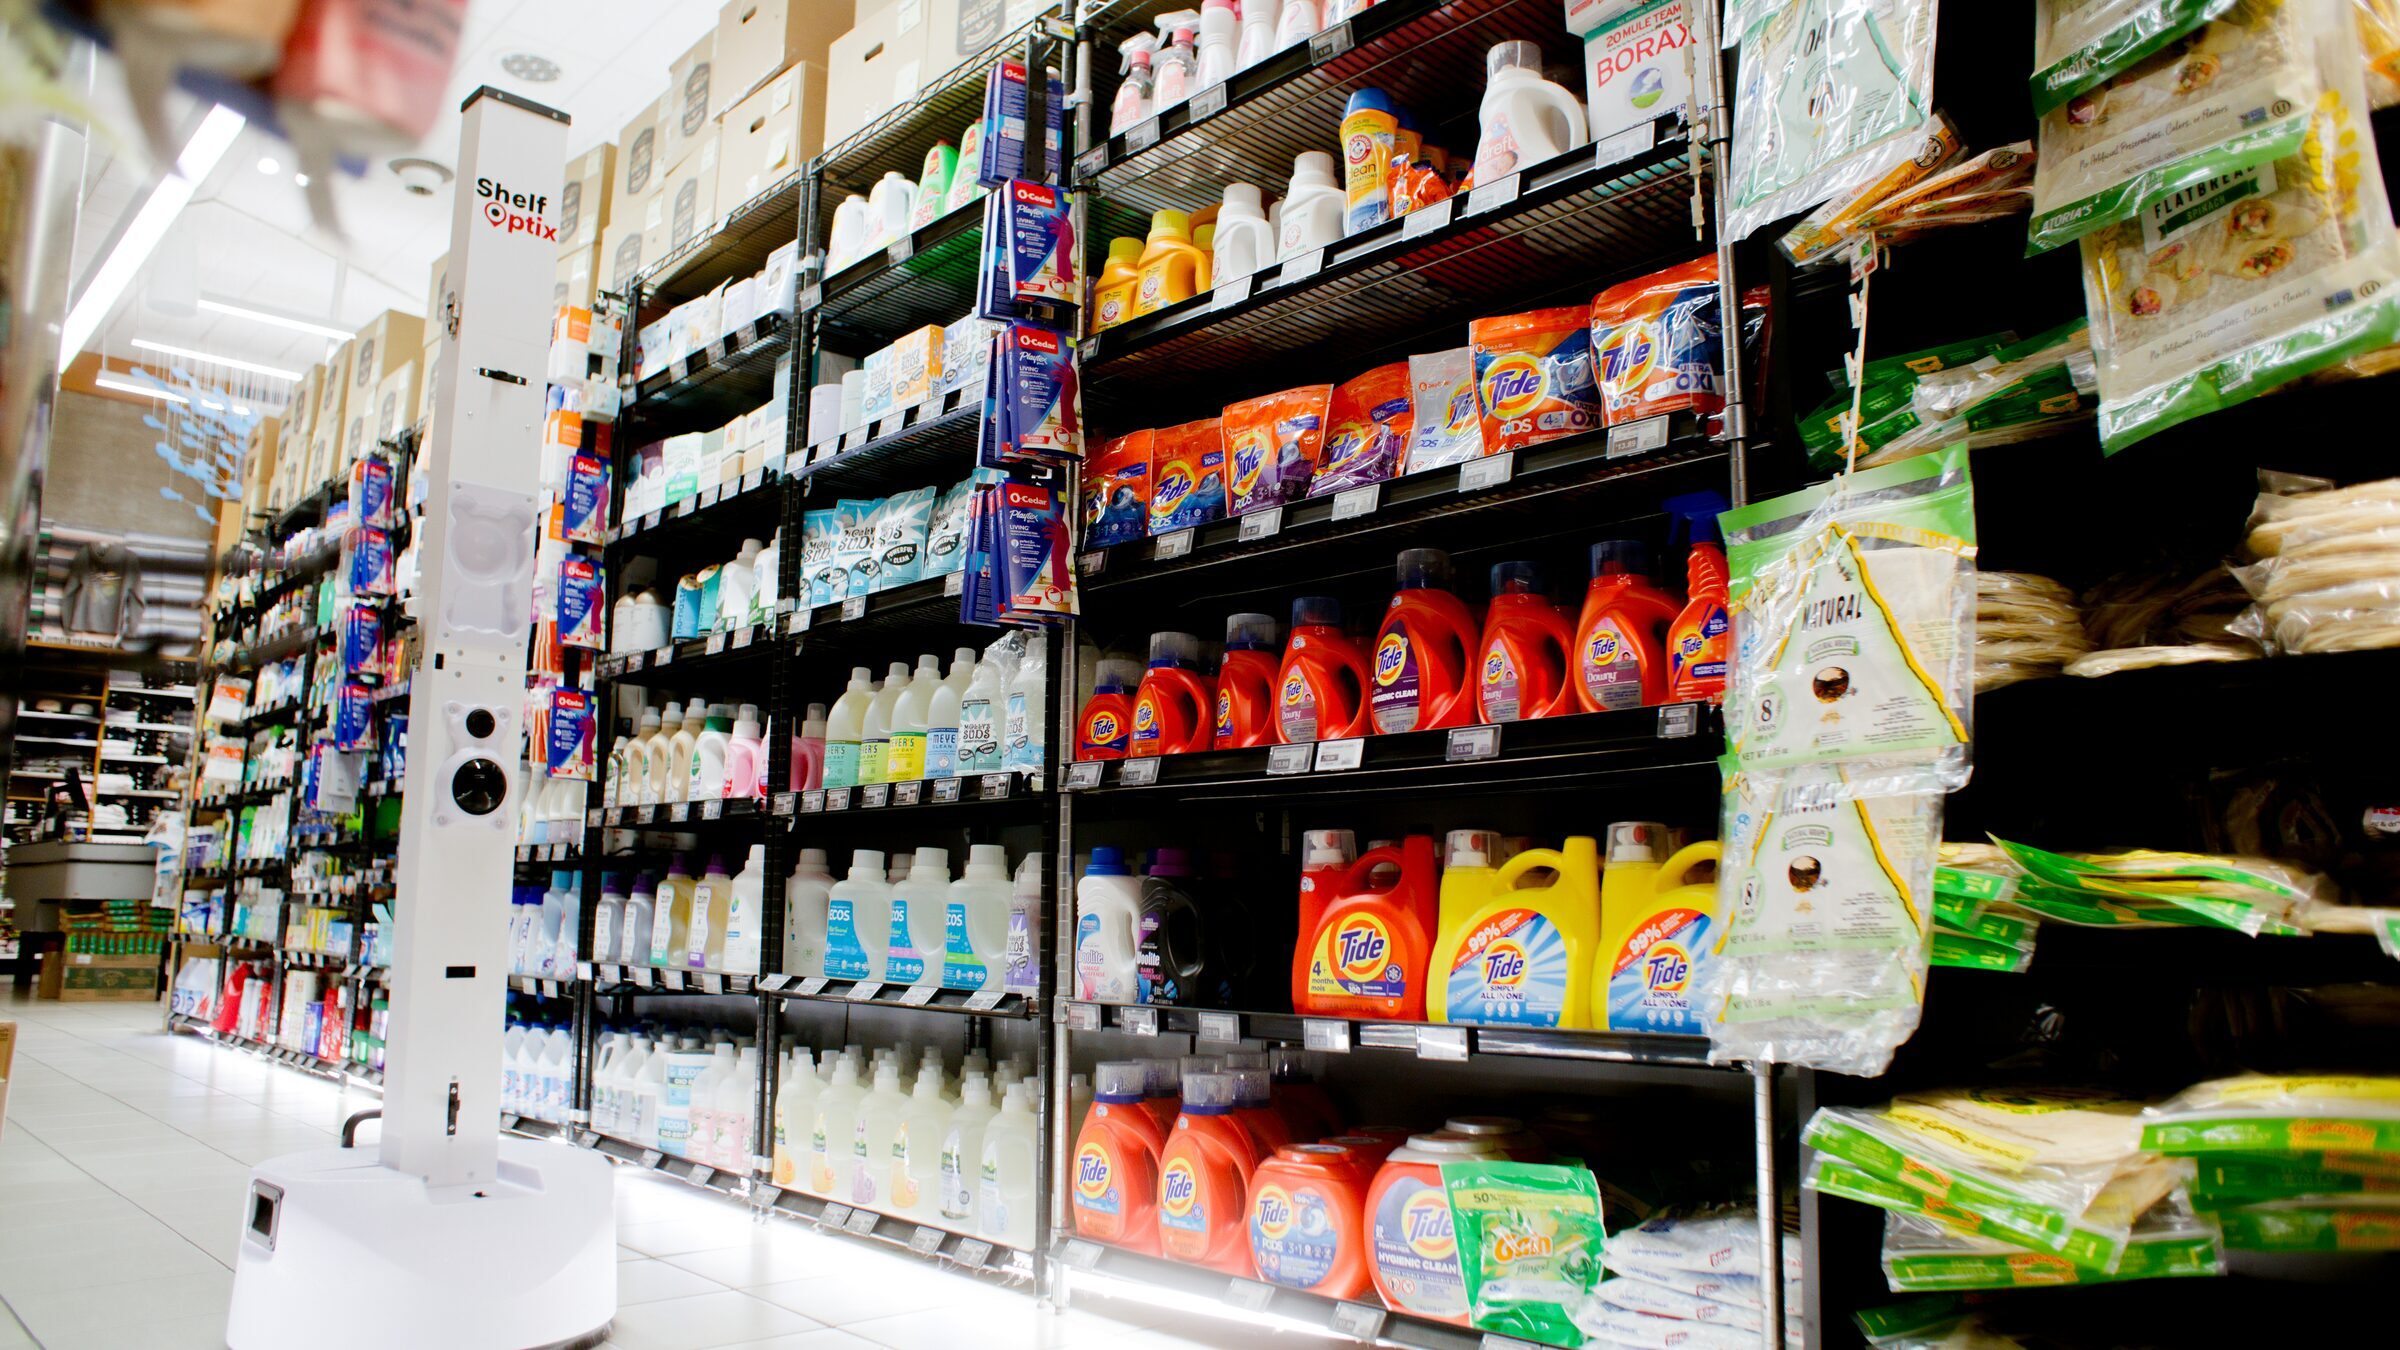
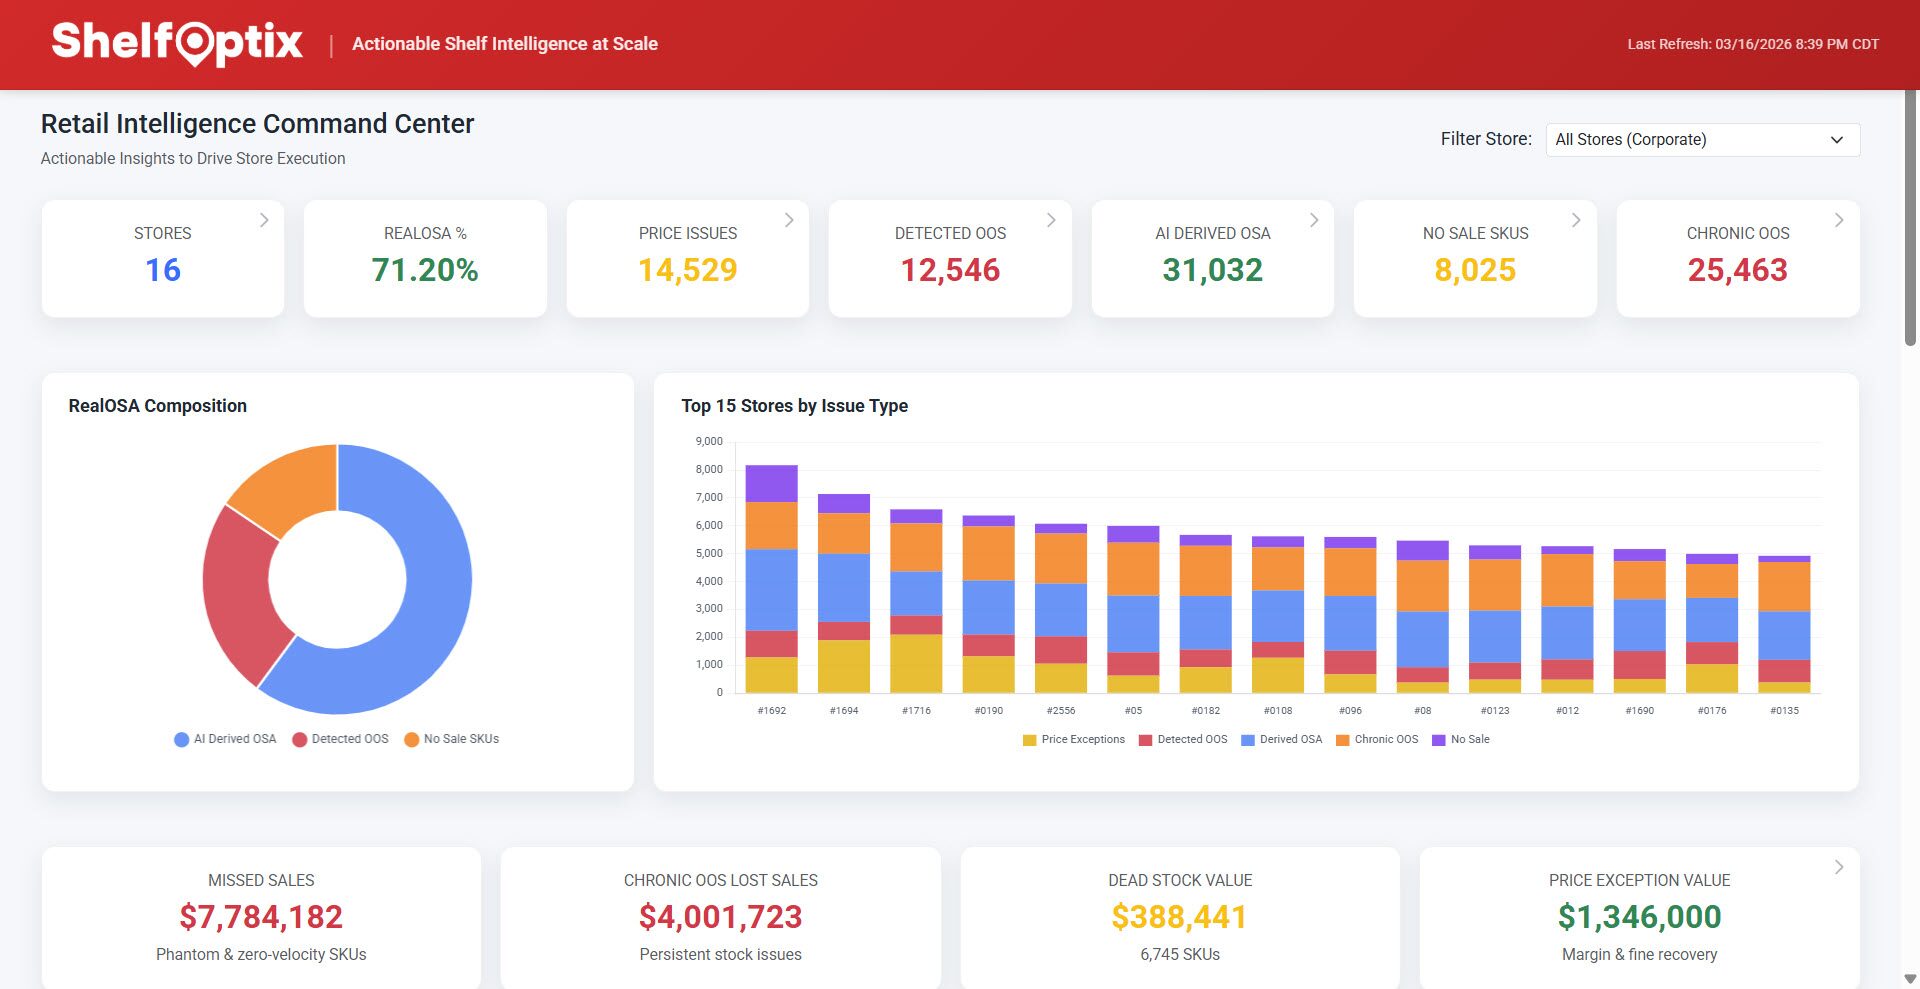
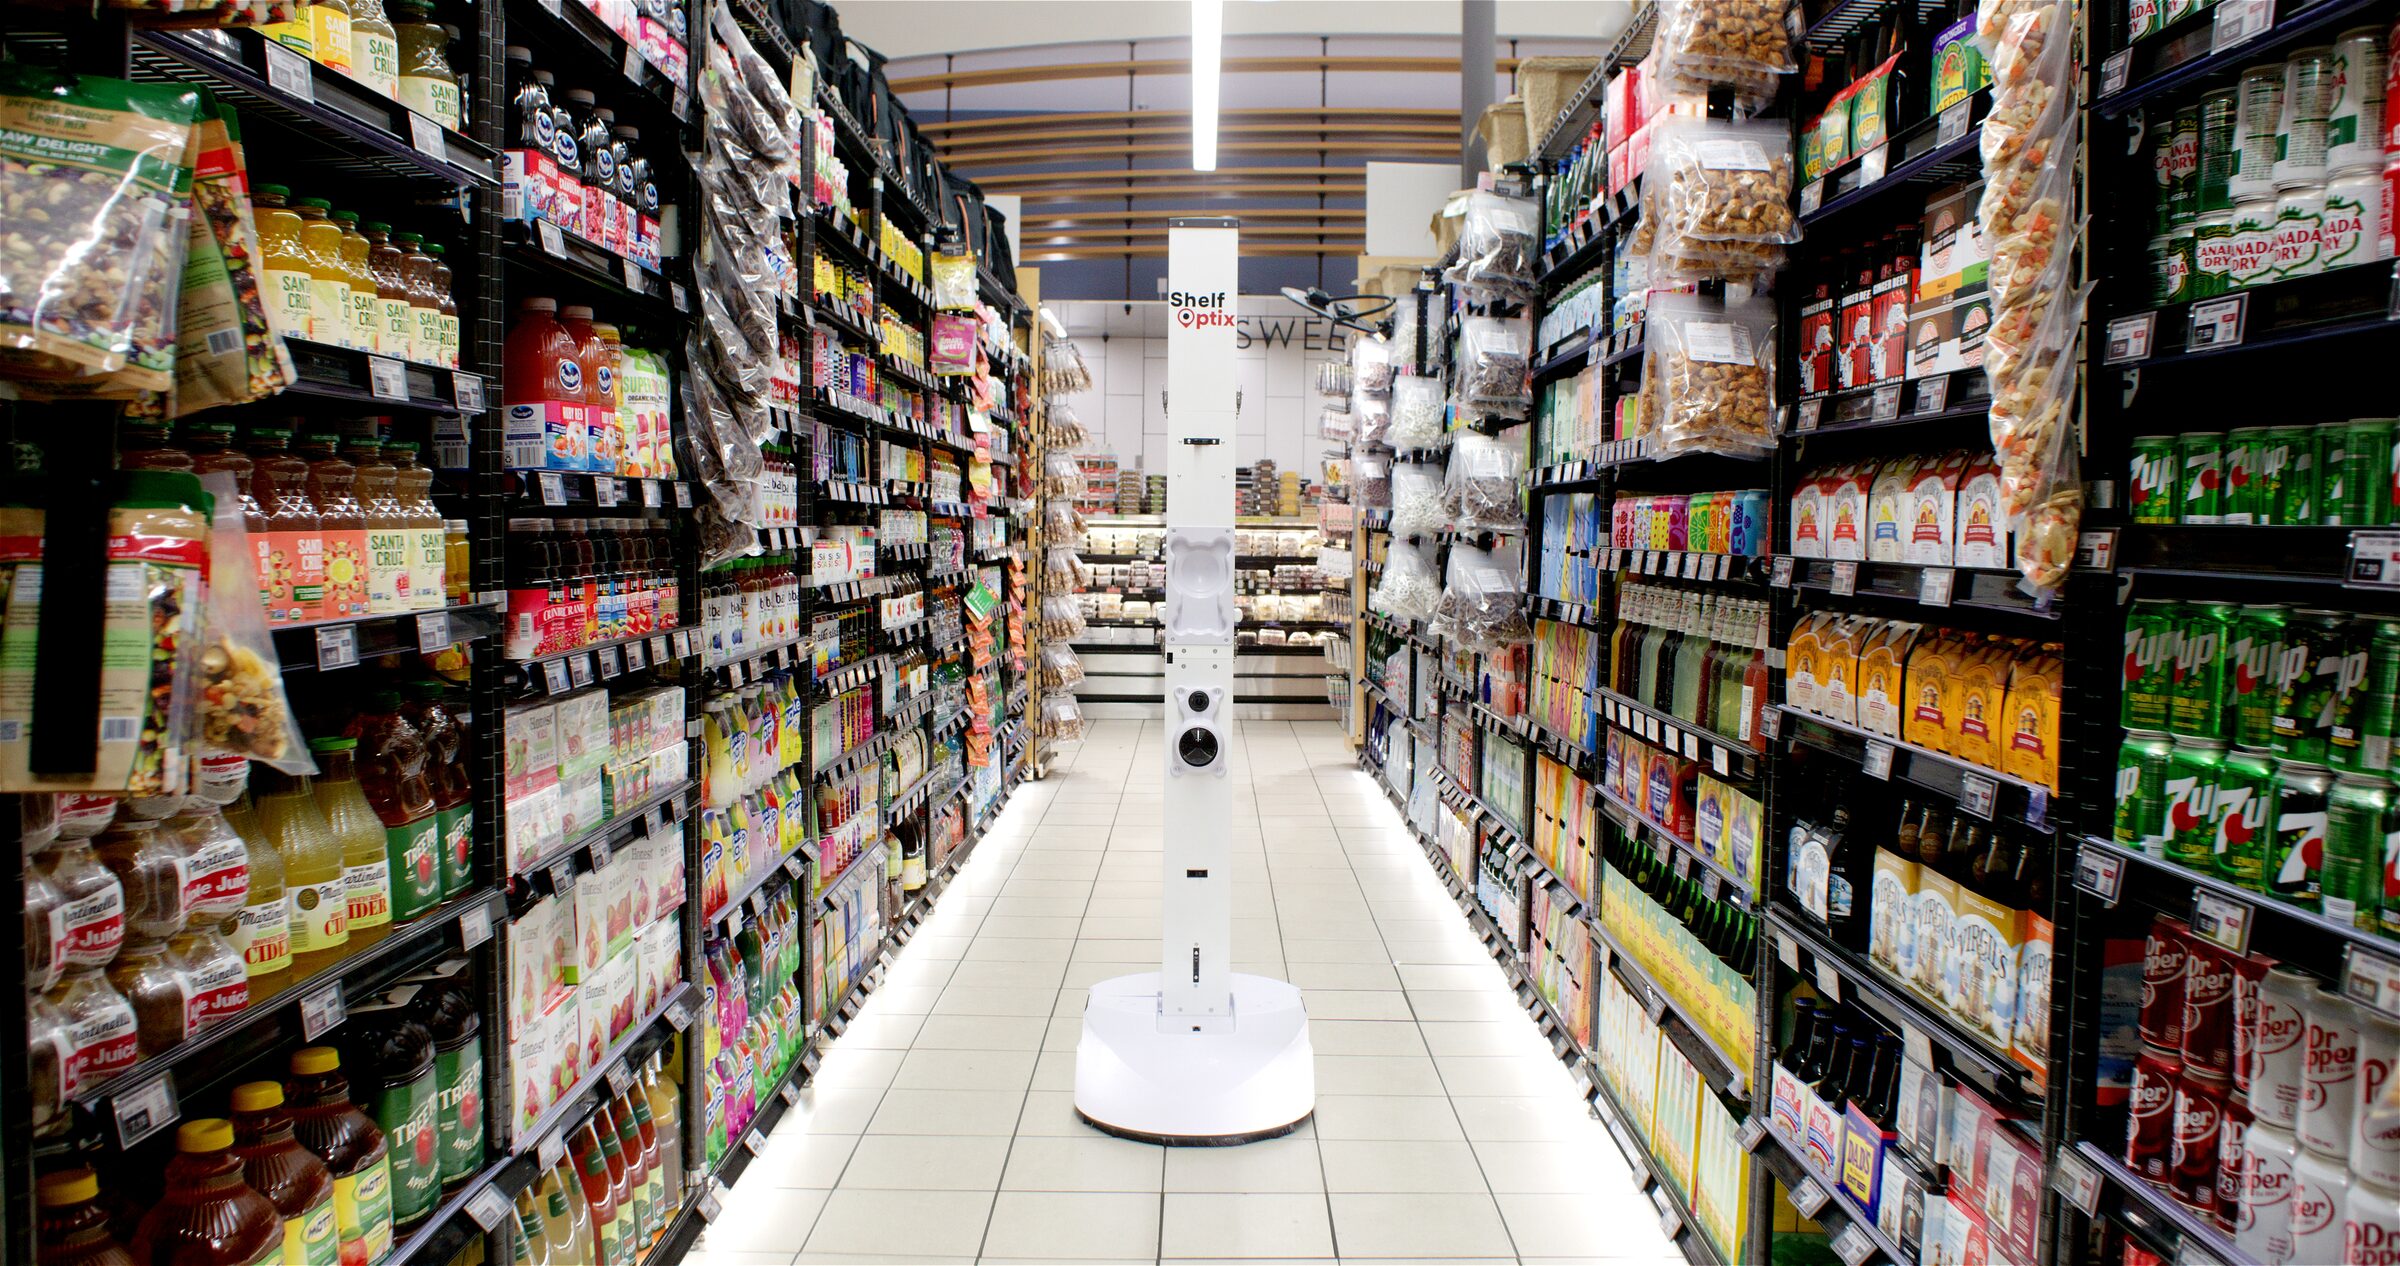
That is the case for continuous ground-truth scanning, and it is why we built a managed scanning model rather than selling robots. The robot captures every facing on a scheduled cadence with a human escort; the platform scores each facing against the active planogram version; and POG integrity signals route what needs fixing to the people who can fix it, without adding a task to store teams. When the fix is a physical one — a facing rebuilt, a tag corrected, a section brought back to plan — it goes to Driveline’s national reset and merchandising teams. ShelfOptix finds the problem; Driveline closes it. The output is not a report card. It is a per-store decay rate you can plan against — which stores hold a reset, which shed it in three weeks, and which of the five events is responsible.
Reset decay stops being a mystery the moment the same shelf is measured twice. Most chains have never done that. The ones that start find out quickly that their best and worst stores were never running the same process at all — and that the fix is targeted, cheap, and nothing like a chain-wide re-reset.
A planogram reset is the physical rebuild of a shelf section to match a new or revised planogram. It is triggered by a range review, a seasonal transition, a new-item cut-in, or a store remodel. A crew strips the section, rebuilds it to the new plan, and re-tags it. The reset is the event; planogram compliance is what happens to that shelf for every day afterward until the next correction.
Because ordinary store operations move product. Backstock that never reaches the shelf, holes filled with a neighboring item, product borrowed for a promotional display, locally delisted items the planogram still calls for, and shelf tags that no longer match what sits behind them. Research funded by Procter & Gamble and supported by GMA, FMI and NACDS identified these same mechanisms as primary causes of shelf out-of-stocks, and found that simply enforcing three item-management practices reduced out-of-stocks by about 40%.
No published study measures the decay curve, and the widely repeated “10% per week” figure has no traceable source study behind it. ShelfOptix does observe a rate in that range — roughly 10% of facings drifting off plan per week in the period after a reset — but that is our own measurement from continuous scanning, presented as a ShelfOptix observation rather than an industry benchmark. What the research does establish is that drift is systematic rather than random: store-level execution performance is consistent year over year, which means each store decays at its own characteristic rate. Your decay rate is a property of your stores and has to be measured, not assumed.
Frequently enough to see the shelf change — which for most chains is far more often than the quarterly or semi-annual cycle in place today. A randomized field experiment published in Production and Operations Management found that items subject to external audit were markedly less likely to show a shelf out-of-stock together with an inaccurate inventory record, and that the audits paid for themselves in steady state. Counting causes compliance. The right cadence is the one that matches how fast your shelves actually move off plan.
Five recurring events: restock drift, where backstock never reaches the shelf or lands one position off; hole-covering, where an empty facing is filled with a neighboring product and the gap becomes invisible; promotional borrow, where product is pulled to a secondary display and the home shelf runs bare; delist and data lag, where the planogram still calls for an item the store no longer carries; and tag lag, where the shelf tag no longer matches the product behind it. None is a violation on its own. Together they are the curve.
ShelfOptix scores every facing against the active planogram on a continuous cadence — chain-wide, with zero burden on store teams. Find out which of your stores hold a reset, which shed it in three weeks, and exactly which event is responsible.
Thanks for reaching out. A member of the ShelfOptix™ team will be in touch with you right away.