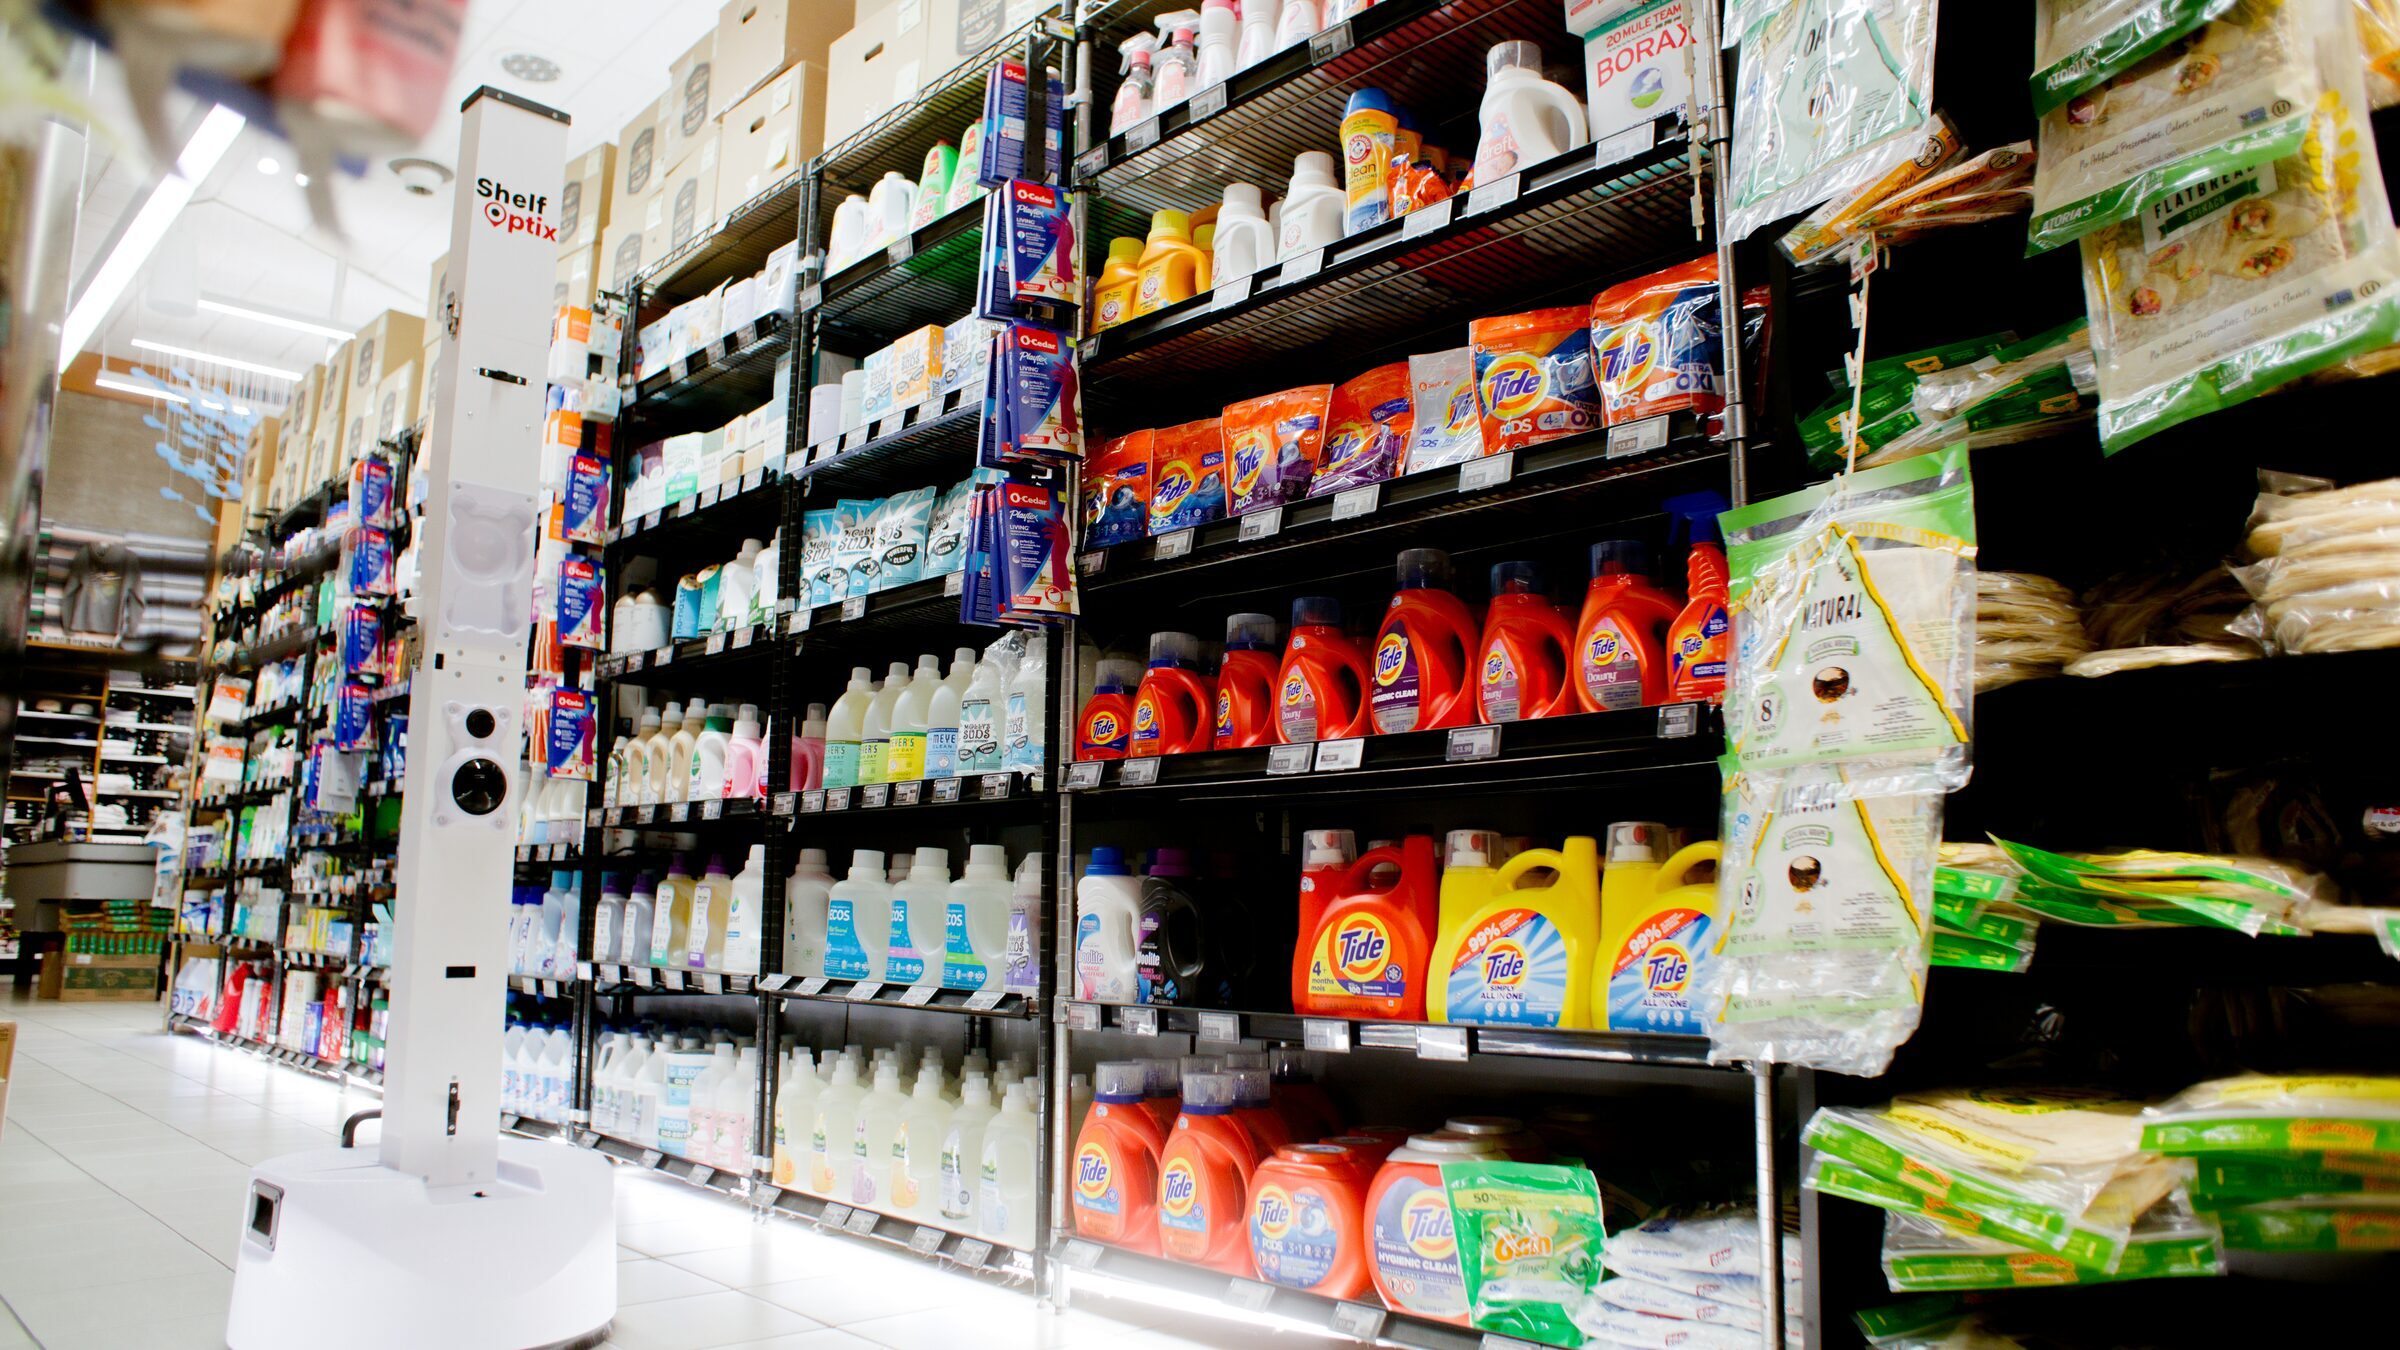
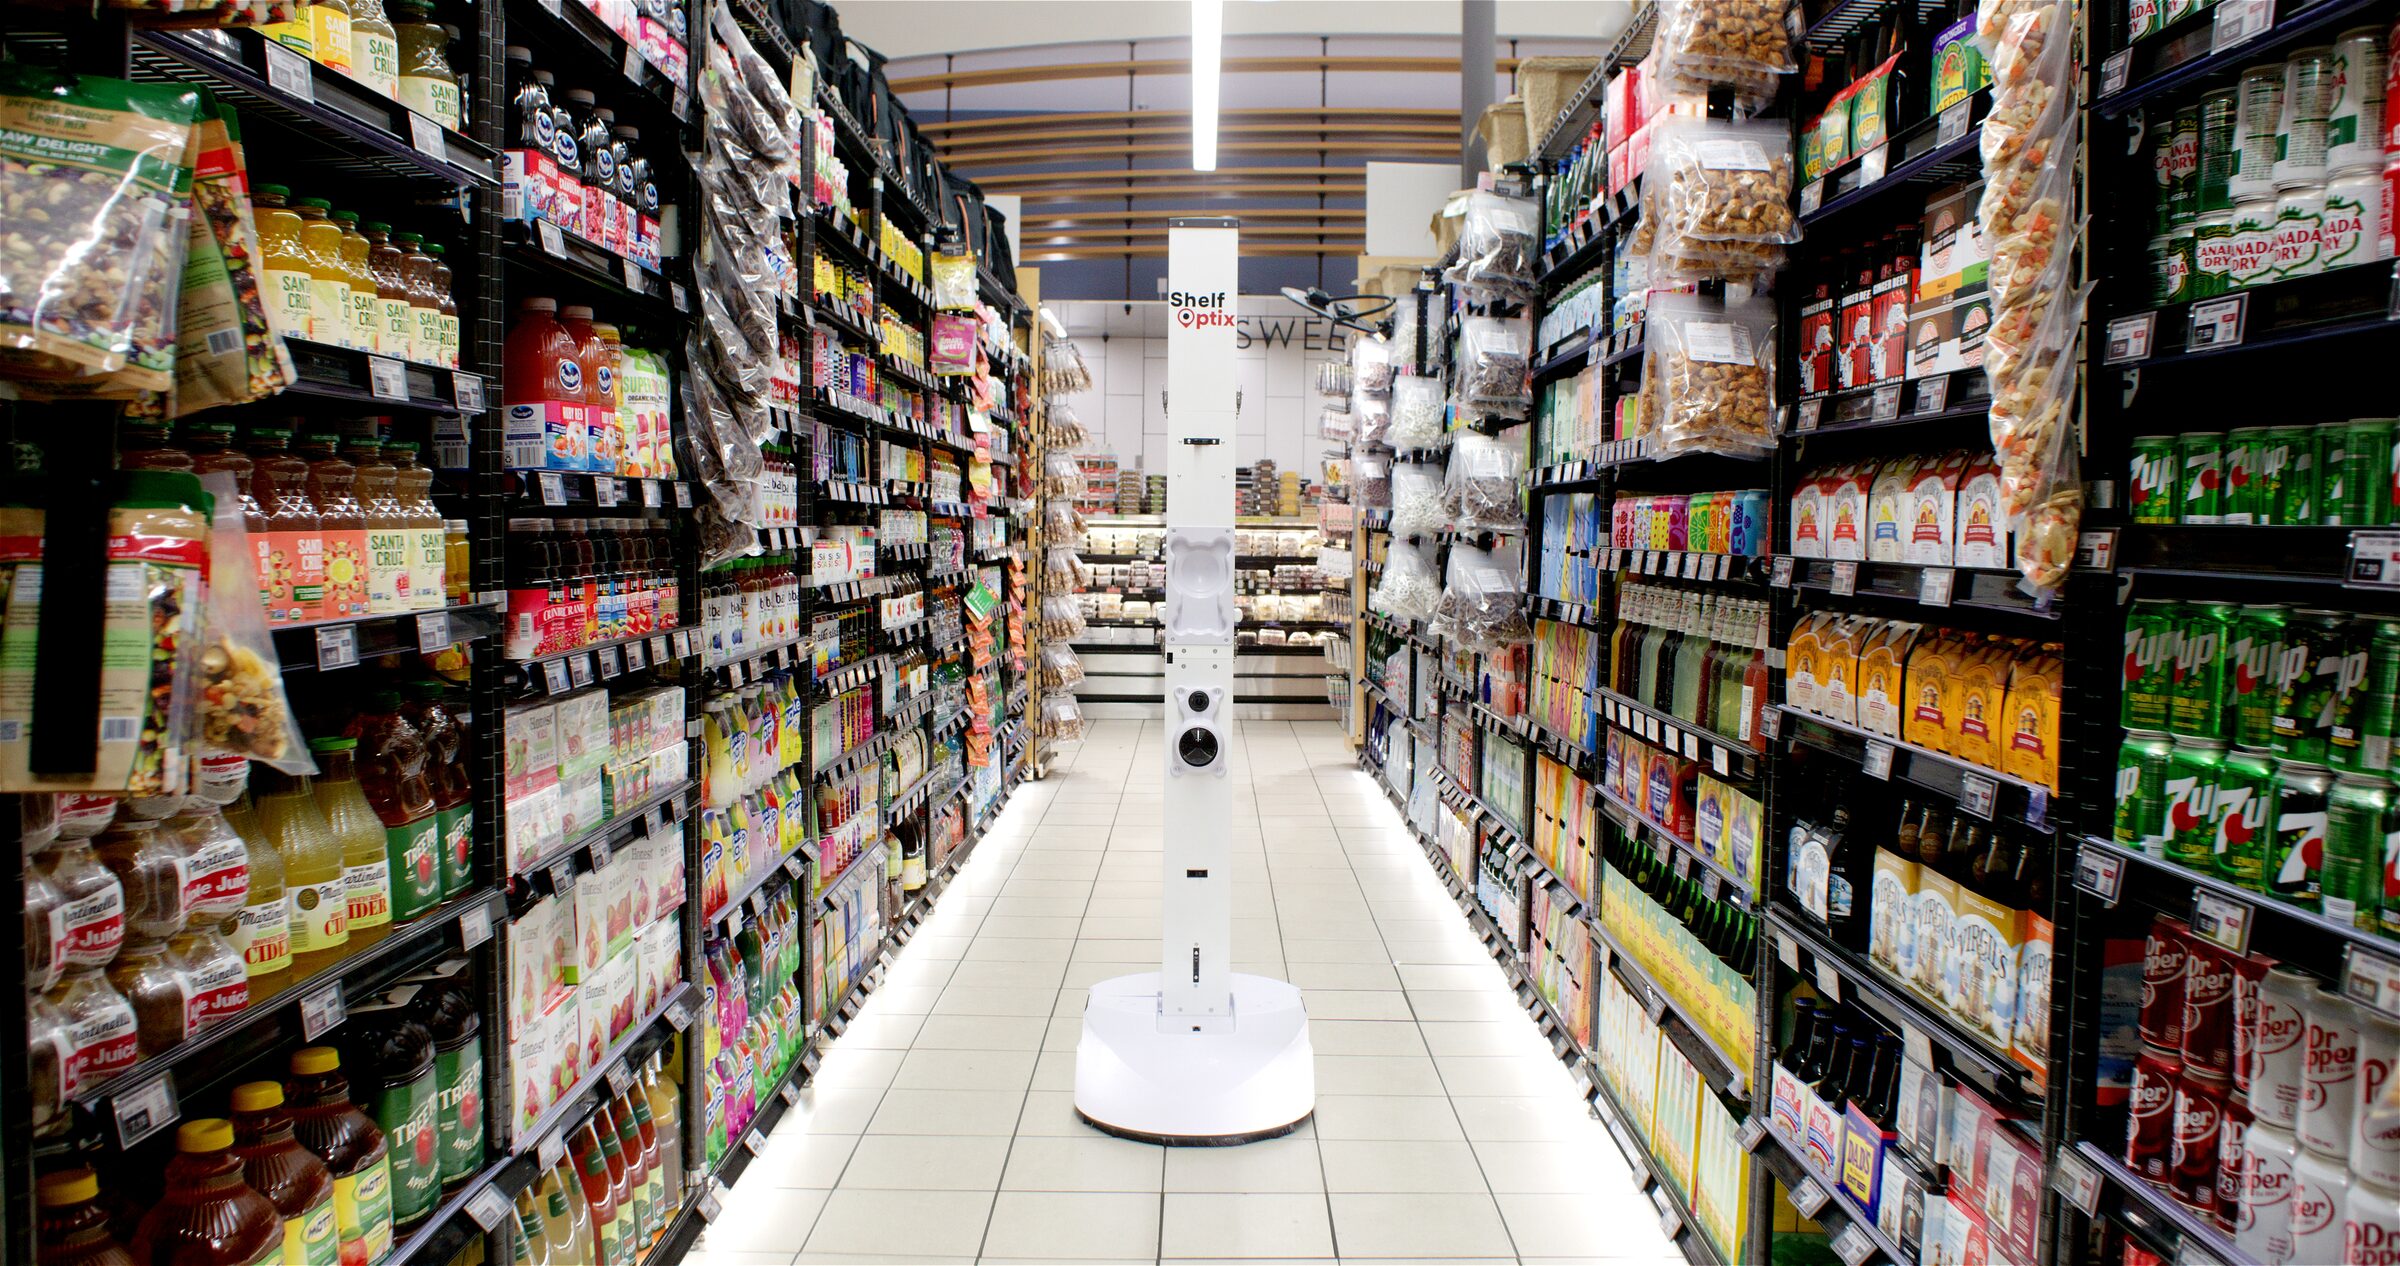
Every reset starts at 100%. Almost no shelf stays there. The pillar guide to planogram compliance — the definition, the formula, the three ways to measure it, and the drift mechanisms that quietly break the plan between audits.
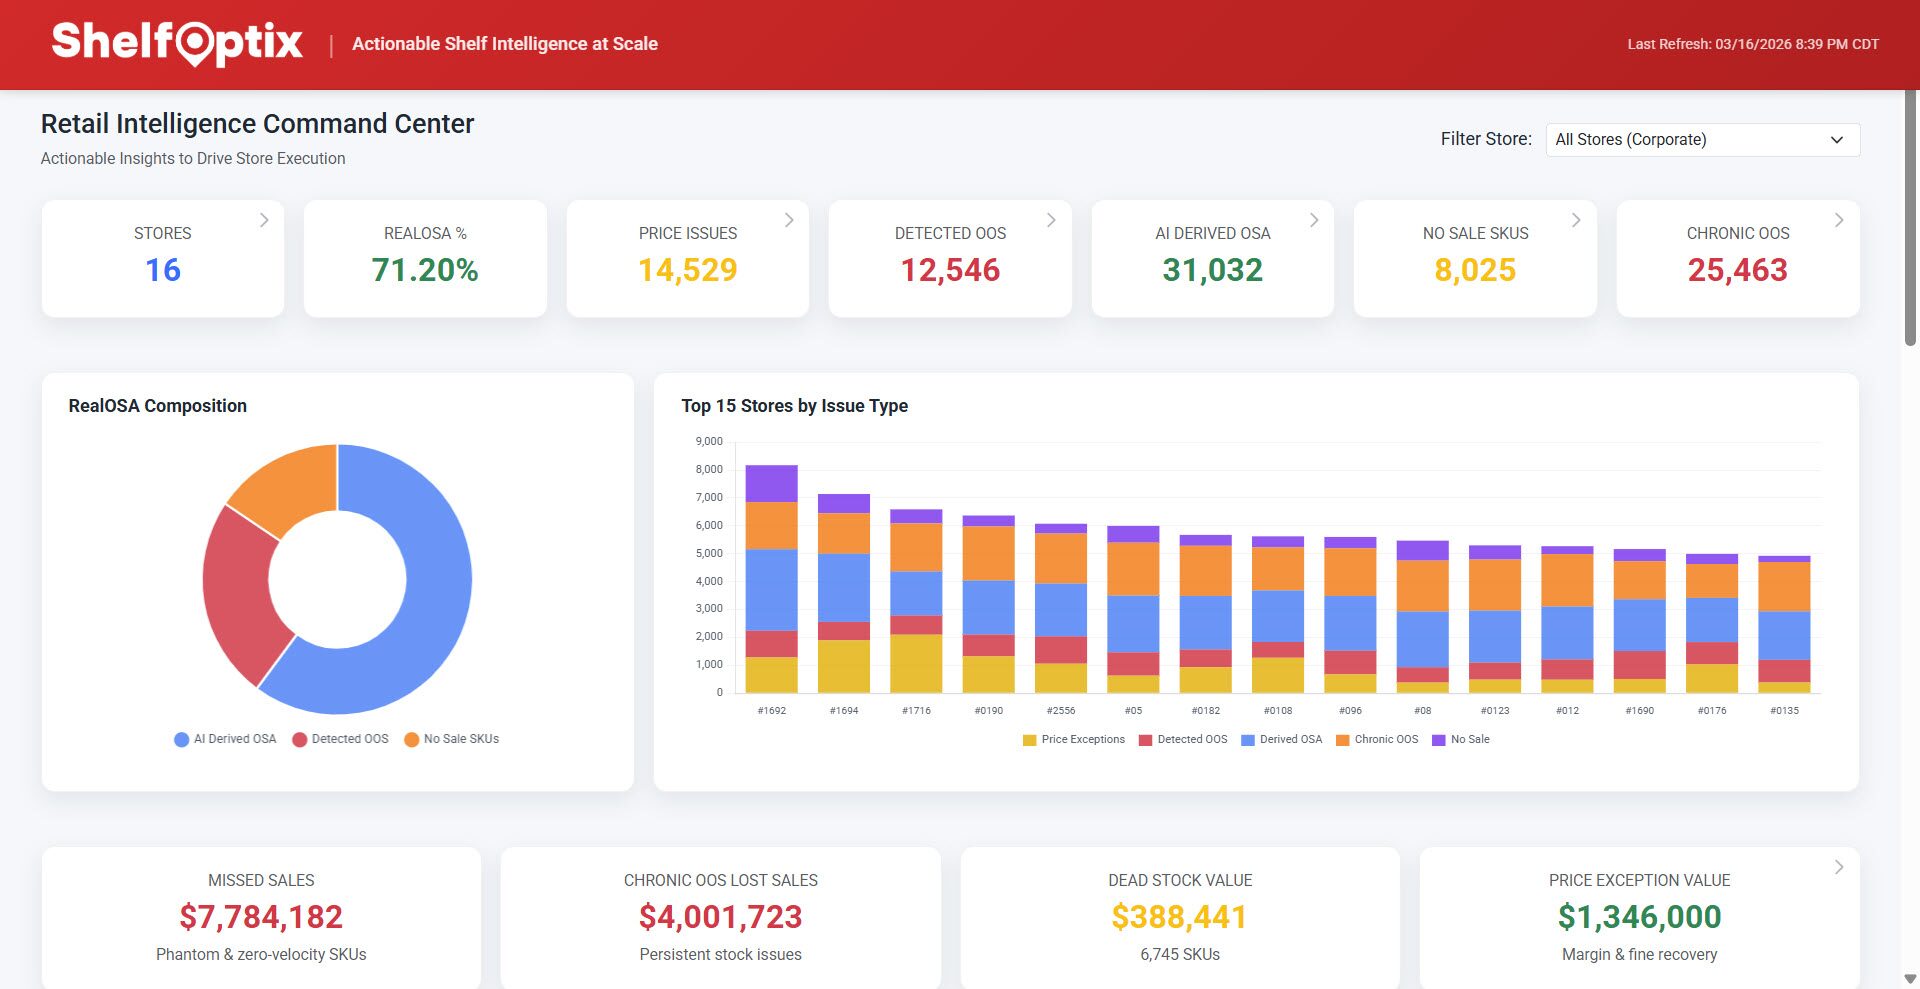
Planogram compliance is the degree to which the actual shelf matches the approved planogram — the right products, in the right positions, at the right facing counts, with the right tags. It is expressed as a percentage: compliant facings divided by planned facings. A shelf at 100% looks exactly like the plan.
Category managers spend months negotiating the plan. Trade teams fund it. Reset crews build it. And then, from the moment the crew walks out the door, the shelf starts drifting away from it — one facing at a time, in ways nobody at headquarters can see.
That gap between the planned shelf and the real shelf is one of the most expensive blind spots in retail. This guide covers what planogram compliance actually measures, the formula behind the percentage, what non-compliance looks like in the aisle, the three ways retailers and brands measure it today, and the two mechanisms that make shelves drift in the first place.
A planogram (often shortened to POG) is a visual diagram that specifies exactly how products should be arranged on a shelf or display — which SKU goes where, at what shelf height, in what sequence, and with how many facings. It turns category strategy into a buildable blueprint for the store.
Planograms exist because shelf position is not neutral. Eye-level placement outsells bottom-shelf placement. Adjacency drives cross-purchase. Facing counts are calibrated to velocity so fast movers don’t run bare between restocks. Every one of those decisions is negotiated between retailer category teams and the brands who fund the space — which means every planogram encodes both a merchandising strategy and a commercial agreement.
Compliance is the measurement layer on top of the plan. A planogram answers “what should the shelf look like?” Planogram compliance answers “does it?” — product by product, facing by facing, store by store. Without that second layer, the planogram is a strategy document with no feedback loop: HQ knows what was supposed to happen, and nothing more.
The formula is simple; the discipline is in the definitions. Three decisions determine whether your compliance number means anything:
What does “good” look like? Most chains target 90%+. Across the shelves ShelfOptix scans, facing-level compliance measured objectively lands consistently below that target — frequently far below. That is our own observation from continuous scanning rather than a published industry benchmark; no study we can find measures objectively-audited facing-level compliance at scale. That spread — between the number in the deck and the number in the aisle — is precisely why measurement method matters so much.
Non-compliance is rarely a trashed shelf. It’s an accumulation of small, individually-reasonable deviations. The most common patterns:
The item is authorized and in the plan — but never made it to the shelf, or was delisted locally without the planogram being updated.
Products present but shuffled — the eye-level facing your brand funded now sits on the bottom shelf.
Four planned facings quietly become two as neighboring products expand into the gap after each restock.
Shelf tag and product disagree — wrong price, wrong item, or a tag for a product that no longer lives there.
Empty facings the system thinks are stocked — phantom inventory masquerading as compliance.
The store is still built to last quarter’s planogram — the new plan shipped, but the reset never fully happened.
We broke down the strategic cost of these gaps — and why they compound at scale — in The Planogram Gap. The short version: each deviation looks harmless in isolation, and collectively they erode the exact placements that category strategy and trade spend paid for. Non-compliance also directly degrades on-shelf availability: a facing that isn’t where the plan says it should be is a facing the replenishment process can’t protect.
“A planogram without compliance measurement is a strategy document with no feedback loop. HQ knows what was supposed to happen — and nothing more.”
Every measurement approach in the market is a variation of three models. They differ on the axes that matter: cadence, coverage, objectivity, and the burden they place on people in the store.
| Method | How it works | Cadence & coverage | Trade-offs |
|---|---|---|---|
| Manual audit | A rep, merchandiser, or store associate walks the section with a checklist or audit app and scores the shelf against the planogram. | Weeks to months between visits; samples of stores and categories, not full coverage. | Flexible and human-verified, but slow, expensive per store, subjective between auditors, and blind between visits. |
| Photo recognition | Field teams or associates photograph the shelf; computer vision matches the image against the planogram and scores each facing. | Days to weeks; coverage depends on who takes the photos and how often. | More objective than a clipboard, but still labor-dependent — someone must stand in front of every section — and image quality drives accuracy. |
| Continuous autonomous scan | Shelf-scanning robots capture the full store on a scheduled cadence; AI scores every facing against the active planogram automatically. | Continuous / scheduled; every aisle, every scan, chain-wide. | Requires a scanning platform — but as a managed service, adds zero labor to store teams and produces facing-level trend data no sample-based method can match. |
The pattern across the three: as measurement gets more frequent and more objective, compliance stops being a quarterly report card and becomes an operational signal — something you can act on while the deviation is still one facing, not a category.
Choosing between these models is really two decisions taken in order. First, which category of software you need — planogram building, compliance monitoring, field execution, or autonomous scanning are four different products that answer four different questions, and our planogram compliance software category map sets out what each one can and cannot see. Second, which vendor within that category — our shelf-intelligence vendor evaluation guide covers the criteria that predict outcomes.
Non-compliance is usually framed as an execution failure — someone didn’t follow the plan. The more useful framing is drift: two structural mechanisms that pull every shelf away from its planogram over time, regardless of how well the reset was executed.
Compliance peaks the day the reset crew finishes and declines from there. Every restock is a small opportunity for a facing to land one position off. Every promotional build borrows space from the home shelf. Every customer interaction reshuffles product. None of these events is a violation — but compounded across weeks, a shelf that started near-perfect can sit well below target before the next audit ever sees it. Crucially, the rate varies enormously between stores in the same chain: drift is a property of a store’s operating process, not a fixed industry constant.
The operational consequence: any measurement cadence slower than the decay curve reports history, not reality. A quarterly audit of a shelf that decays in six weeks is always measuring a shelf that no longer exists. We break the mechanism down in full — the five events that move a facing, what the research actually establishes, and how to set cadence against it — in Reset Decay: What Happens to Your Planogram After the Crew Leaves.
Planograms change on a category calendar — range reviews, seasonal transitions, new-item cut-ins. Each change has to propagate to every store, and it never lands everywhere at once. Between the moment the new planogram is published and the moment the last store completes the change, the chain is measuring stores against a plan that some of them haven’t received, or has already been superseded.
The operational consequence: compliance scoring is only as good as version control. A store scored against the wrong planogram version produces noise — and sample-based audits have no way to tell drift from lag.
Both mechanisms point at the same requirement: measurement that is continuous enough to see the decay curve, and complete enough to distinguish a drifting store from a lagging one. That is the case for ground-truth scanning — and it’s why we built a managed scanning model that delivers it without adding a single task to store teams: the robot captures every facing, the platform scores it against the active planogram, and POG integrity signals route what needs fixing to people who can fix it.
Planogram compliance is the degree to which the actual shelf matches the approved planogram — the right products, in the right positions, at the right facing counts, with the right tags. It is expressed as a percentage: compliant facings divided by planned facings, multiplied by 100. A shelf at 100% compliance looks exactly like the plan; anything below means facings are missing, misplaced, or mis-tagged.
The standard formula is: Planogram Compliance (%) = (Compliant Facings ÷ Planned Facings) × 100. A facing counts as compliant when the correct product occupies the planned position at the planned facing count with correct signage and pricing. Chains typically set a tolerance band — for example, counting a facing compliant if it sits within one position of plan — and measure at the category, store, and chain level.
Most retailers target 90%+, and anything above 90% sustained across stores is best-in-class. Objectively measured reality usually lands well below the target — that is what ShelfOptix consistently observes at the facing level, though no published study benchmarks objectively-audited facing-level compliance at scale. The more useful number is not the score but the rate of change: how fast compliance falls after a reset, which the evidence shows varies substantially store to store even within one chain.
There is no reliable single figure for planogram non-compliance specifically, but the surrounding evidence is substantial. Coresight Research put in-store execution inefficiencies at 6.4% of US retailers’ gross sales in 2026. Research funded by Procter & Gamble found that a 10-point change in planogram compliance moves out-of-stocks by roughly 1 point — with the important caveat that above about 90% compliance the marginal return is low. And a 2000 study for NARMS documented a category sales lift of around 8% from timely shelf maintenance.
Two ways: photo recognition — field reps or store associates photograph the shelf and computer vision scores it against the planogram — and continuous autonomous scanning, where robots capture the full shelf on a scheduled cadence and score every facing automatically. Autonomous scanning is the only method that produces chain-wide, facing-level compliance data without adding labor to store teams.
ShelfOptix scores every facing against the active planogram — continuously, chain-wide, with zero burden on store teams. Know your real compliance number, watch the decay curve, and fix drift while it’s still one facing.
Thanks for reaching out. A member of the ShelfOptix™ team will be in touch with you right away.