Tags, cameras, and locked cases target theft. Receiving errors and vendor shorts land in the same shrink number, and a theft tool cannot see them. This guide maps eight tool types to the four causes of shrink so you buy against the part of the loss you actually have.
Retail shrinkage reduction starts with matching each tool to the cause of the loss. Most loss prevention technology sold today targets external or employee theft, so it does nothing for process errors and vendor errors, which land in the same shrink number.
Shrink has four causes: external theft, employee theft, process and administrative error, and vendor fraud or error. A shoplifter, a dishonest cashier, a receiving clerk who keys the wrong case count, and a vendor who ships short all produce the same line on the count report. A camera at the door sees only the first of them.
This guide is the buyer's view of shrink reduction. It covers what each tool type detects, what it misses, and how to choose. For the definition of shrink, the formulas, and the four causes in detail, read Retail Shrink Explained.
A shrink total tells you how much is missing. It does not tell you why. If you buy cameras against a loss that is mostly receiving error, the shrink number will not move, and the tool will look like a failure when the problem was the diagnosis. Split your variance by cause first, by department and by store. The six-step procedure for doing that is in Retail Shrink Explained. Bring the result to every vendor conversation.
Read across each row to see which causes a tool type addresses. Detects means the tool finds that cause directly. Deters means it makes that cause harder, with published trial evidence. Partial means it covers a narrow slice. Partial* means the tool is sold for that cause but we found no published controlled study of its effect. No means the tool cannot see that cause. The ratings are our reading of the published evidence and of how each tool works.
| Tool type | External theft | Employee theft | Process error | Vendor error |
|---|---|---|---|---|
| EAS tags and gates | Partial | Partial* | No | No |
| CCTV and AI video | Detects | Partial* | Partial | No |
| Item-level RFID | Partial* | Partial* | Detects | Detects |
| POS exception reporting | Partial* | Partial* | Partial* | No |
| Locked cases and fixtures | Deters | Partial* | No | No |
| Receiving and DSD checks | No | Partial* | Detects | Detects |
| Cycle counting | No | No | Detects | Partial |
| Shelf scanning | No | No | Detects | Partial |
Two patterns stand out. The theft columns are full of Partial* ratings, which means much of what is sold for theft has never been tested in a controlled study. And only four of the eight tool types reach the process and vendor columns at all. Cycle counting and shelf scanning find a gap between the record and the shelf. They do not tell you whether a person took the product, which is why they read "No" in the theft columns.
Electronic article surveillance puts a tag on the product and a gate at the exit that alarms when a live tag passes. The evidence is mixed. Hayes and Blackwood ran a 21-store field test of source-tagged EAS, published in Security Journal in 2006, and found it did not reduce item loss, raise on-shelf availability, or raise store-level sales. Gates see only tagged items leaving through a gated door. They do not see a receiving miscount, a price file error, a short shipment, or product that leaves through the back.
Cameras record the store, and AI video flags events such as items that pass a self-checkout without a scan. ECR Retail Loss's 2026 self-checkout study found that 7 of 14 companies testing non-scan detection reported positive results, and 5 of 11 using customer-facing display monitors reported loss reductions of up to 12%. The same study found missed scans in 1% to 4.8% of self-checkout transactions and estimated that between 6% and 80% of non-scans were deliberate. Part of what checkout cameras catch is honest error at the till. Cameras do not count cartons at the dock or correct the inventory record.
RFID tags let you count stock and check deliveries without scanning each barcode. In Professor Adrian Beck's 2018 study of 10 retailers for ECR Retail Loss, inventory accuracy rose from about 65% to 75% before RFID to 93% to 99% after it. Few of the companies saw RFID as an effective way to reduce stock loss, and only 2 of the 10 tracked stock loss as a measure of success. Tags are easy to remove and exit readers were unreliable. RFID is a record and receiving tool first and a theft tool second.
Exception-based reporting scans register data for unusual voids, refunds, price overrides, discounts, and no-sale opens, by cashier and shift. It points investigators at the tills worth a closer look. It misses anything that never touches a register: shoplifters who walk out, product diverted from the backroom, and every error at the receiving dock. We found no published controlled study that measures its effect on shrink, so treat vendor results as vendor claims.
This category has the strongest trial evidence. In a randomized trial across 57 stores, published in the Journal of Experimental Criminology in 2012, Hayes, Downs, and Blackwood found that protective display fixtures cut loss on a high-theft item by 56% and special handling procedures cut it by 58%, compared with control stores. A separate 10-store randomized trial of locked "keeper" boxes, published in 2011, reported shrink down 52% and sales up 69% over 13 weeks. Both trials tested a single high-theft product. Locks do nothing for the record, and a case that takes too long to open costs sales, so measure sales alongside loss.
Receiving checks compare what arrived with the purchase order and the vendor's advance ship notice, through blind counts, scan-based receiving, and direct store delivery (DSD) check-in. They catch short shipments, wrong pack sizes, duplicate billing, and damage on arrival, before a wrong count enters the record. In the Auburn University RFID Lab and GS1 US study published in 2018, only 31% of orders received by barcode fully matched the ship notice. The authors warn this does not mean the other 69% of shipments were wrong, and the sample was small and mostly apparel. It does show how often the record and the delivery disagree at the dock. Receiving checks fail when a busy dock skips the count.
Cycle counting counts a set of items on a schedule instead of the whole store once a year. A white paper by Chapman and Templar of Cranfield University for ECR Europe recommends counting high-theft "hot products" at least once a month. Frequent counts show where and when units went missing, which shortens the time between an error and its detection. A count proves that the shelf and the record disagree. It does not prove who caused it. For count methods, read Retail Cycle Counting.
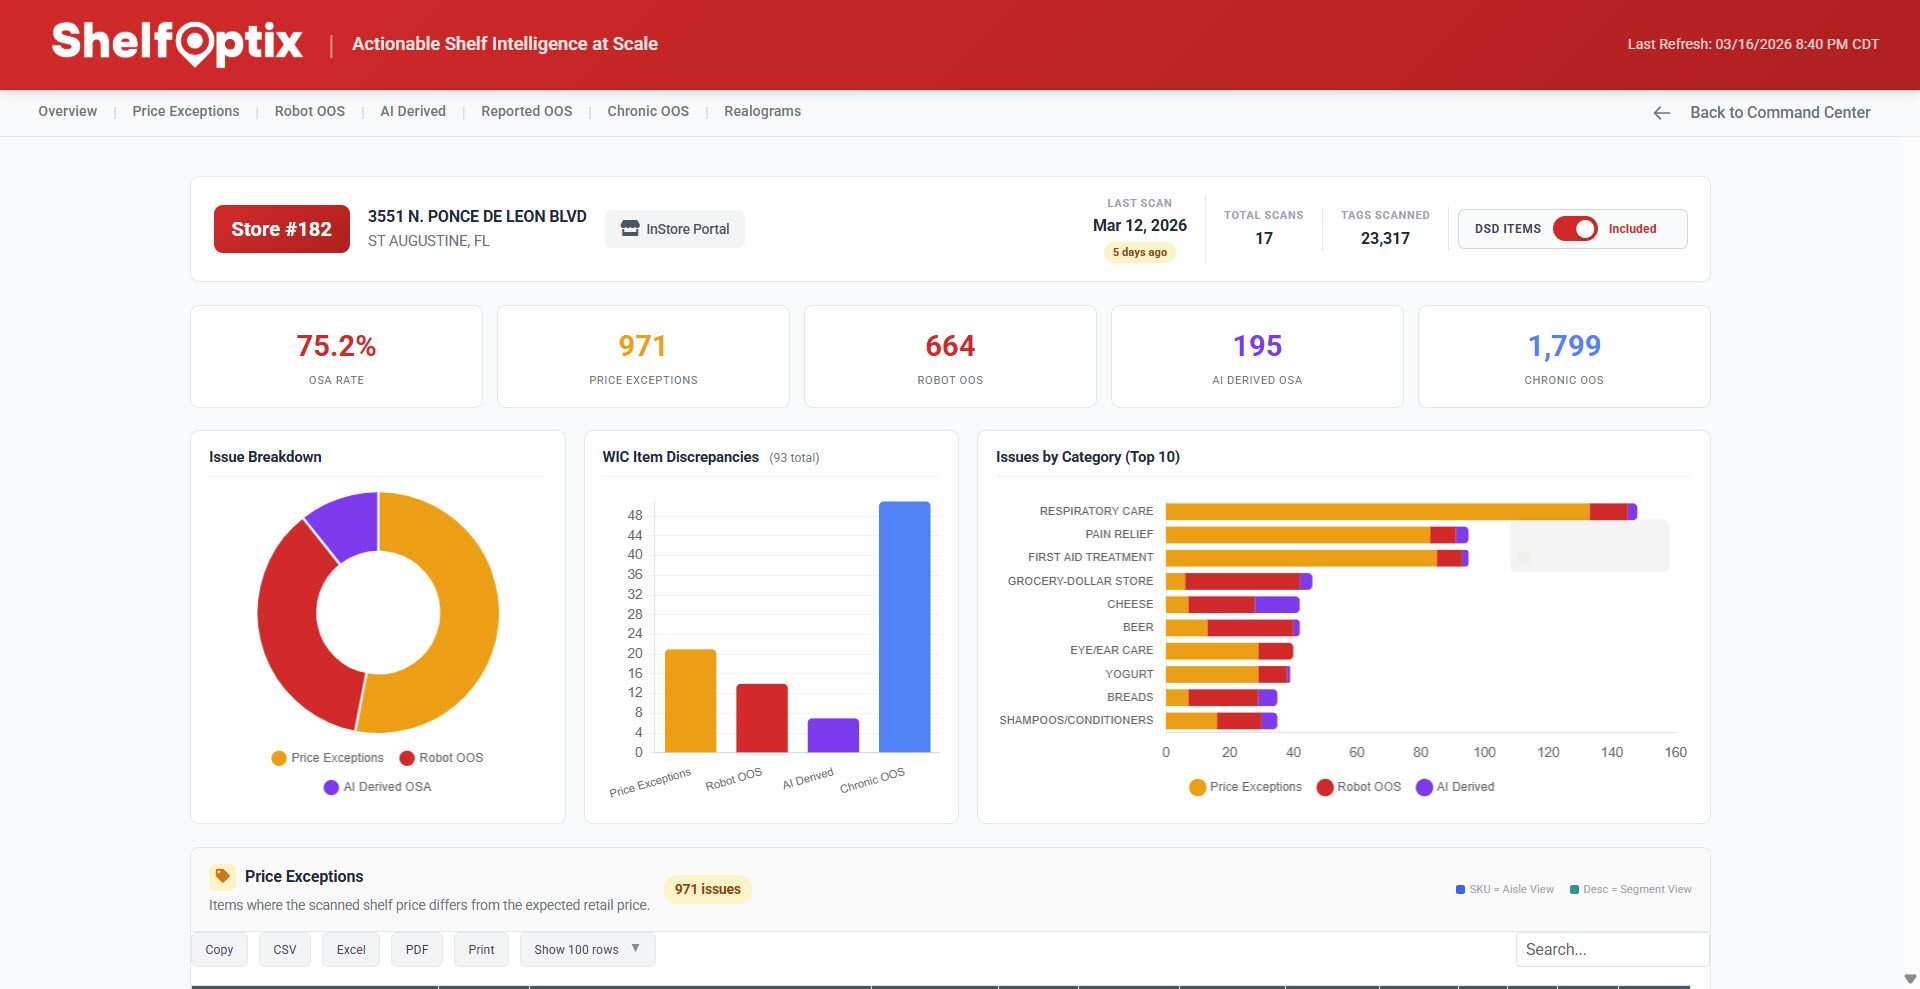
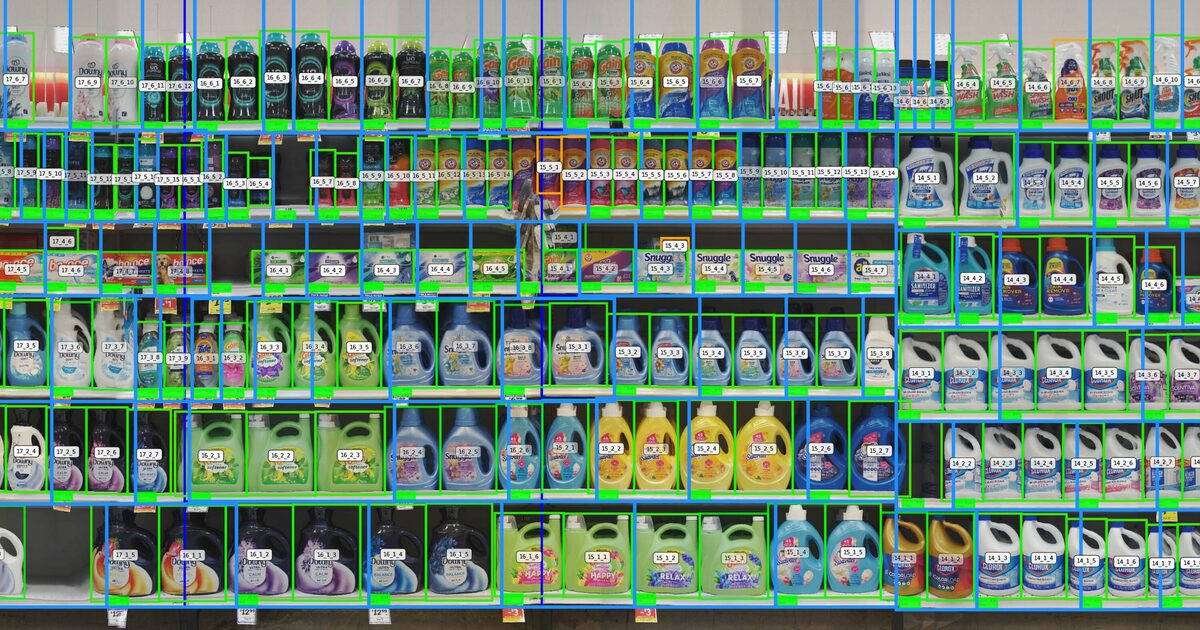
Shelf scanning, by robot, fixed camera, or handheld device, compares what is on the shelf with the inventory record, the planogram, and the shelf-edge price. It finds items the system shows in stock that are not on the shelf, which is the record error behind phantom inventory. It does not detect theft, watch the till, or open sealed cartons at the dock, and it sees the front of the shelf, not the stock behind it. The limits are covered in Why Shelf Computer Vision Degrades in a Live Store.
A camera on the checkout lane cannot count a short-shipped case on the receiving dock.
Process error and vendor error raise your shrink number without a single unit being stolen. A receiving clerk keys 12 cases when 10 arrived. A price file carries the wrong unit of measure. A damaged case goes in the dumpster with no adjustment. A DSD vendor bills for a full delivery and drops a short one. Each of these creates a gap between the record and the shelf, and the next count books that gap as shrink.
The tools that catch these causes sit in operations, not in asset protection: receiving checks, cause codes on every adjustment, frequent counts, and a regular comparison of the shelf with the record. They are cheaper than most security hardware, and they are usually owned by a different team. That ownership gap is why they get skipped.
Grocery shows the problem clearly. McKinsey reported in 2020 that shrink consumed 2% to 3% of a typical grocer's revenue before the pandemic, and that in ready-to-eat and ready-to-heat categories it had risen to 5% to 15% of revenue. The same article reported leading grocers reducing shrink by 20% to 30%. Spoiled fresh food is not stolen, and no camera or lock changes it. Grocery also takes much of its volume through DSD, where the vendor delivers straight to the store and the store's own check-in is the only check. If you want to reduce shrink in a grocery store, start with fresh-department waste logging and DSD receiving before you price security hardware.
FMI's Asset Protection in Food Retail 2026 report found that 85% of food retailers say they are at least somewhat successful against their shrink goals, and FMI notes that analytics, AI, and video help most when combined with operations and trained staff. The order you buy in matters as much as what you buy.
Do not judge a tool by the storewide shrink rate alone. Price changes, seasonal mix, and the timing of counts move that number on their own. Use the method the published trials use: compare stores that have the tool with matched control stores that do not, over the same weeks. Measure count variance by cause code (receiving adjustments, known waste, and unknown loss) in the same departments, before and after the rollout. Track unit sales and on-shelf availability at the same time. A lock that cuts loss and cuts sales by more is not a win, and the keeper-box trial shows a well-designed fixture can raise both protection and sales.
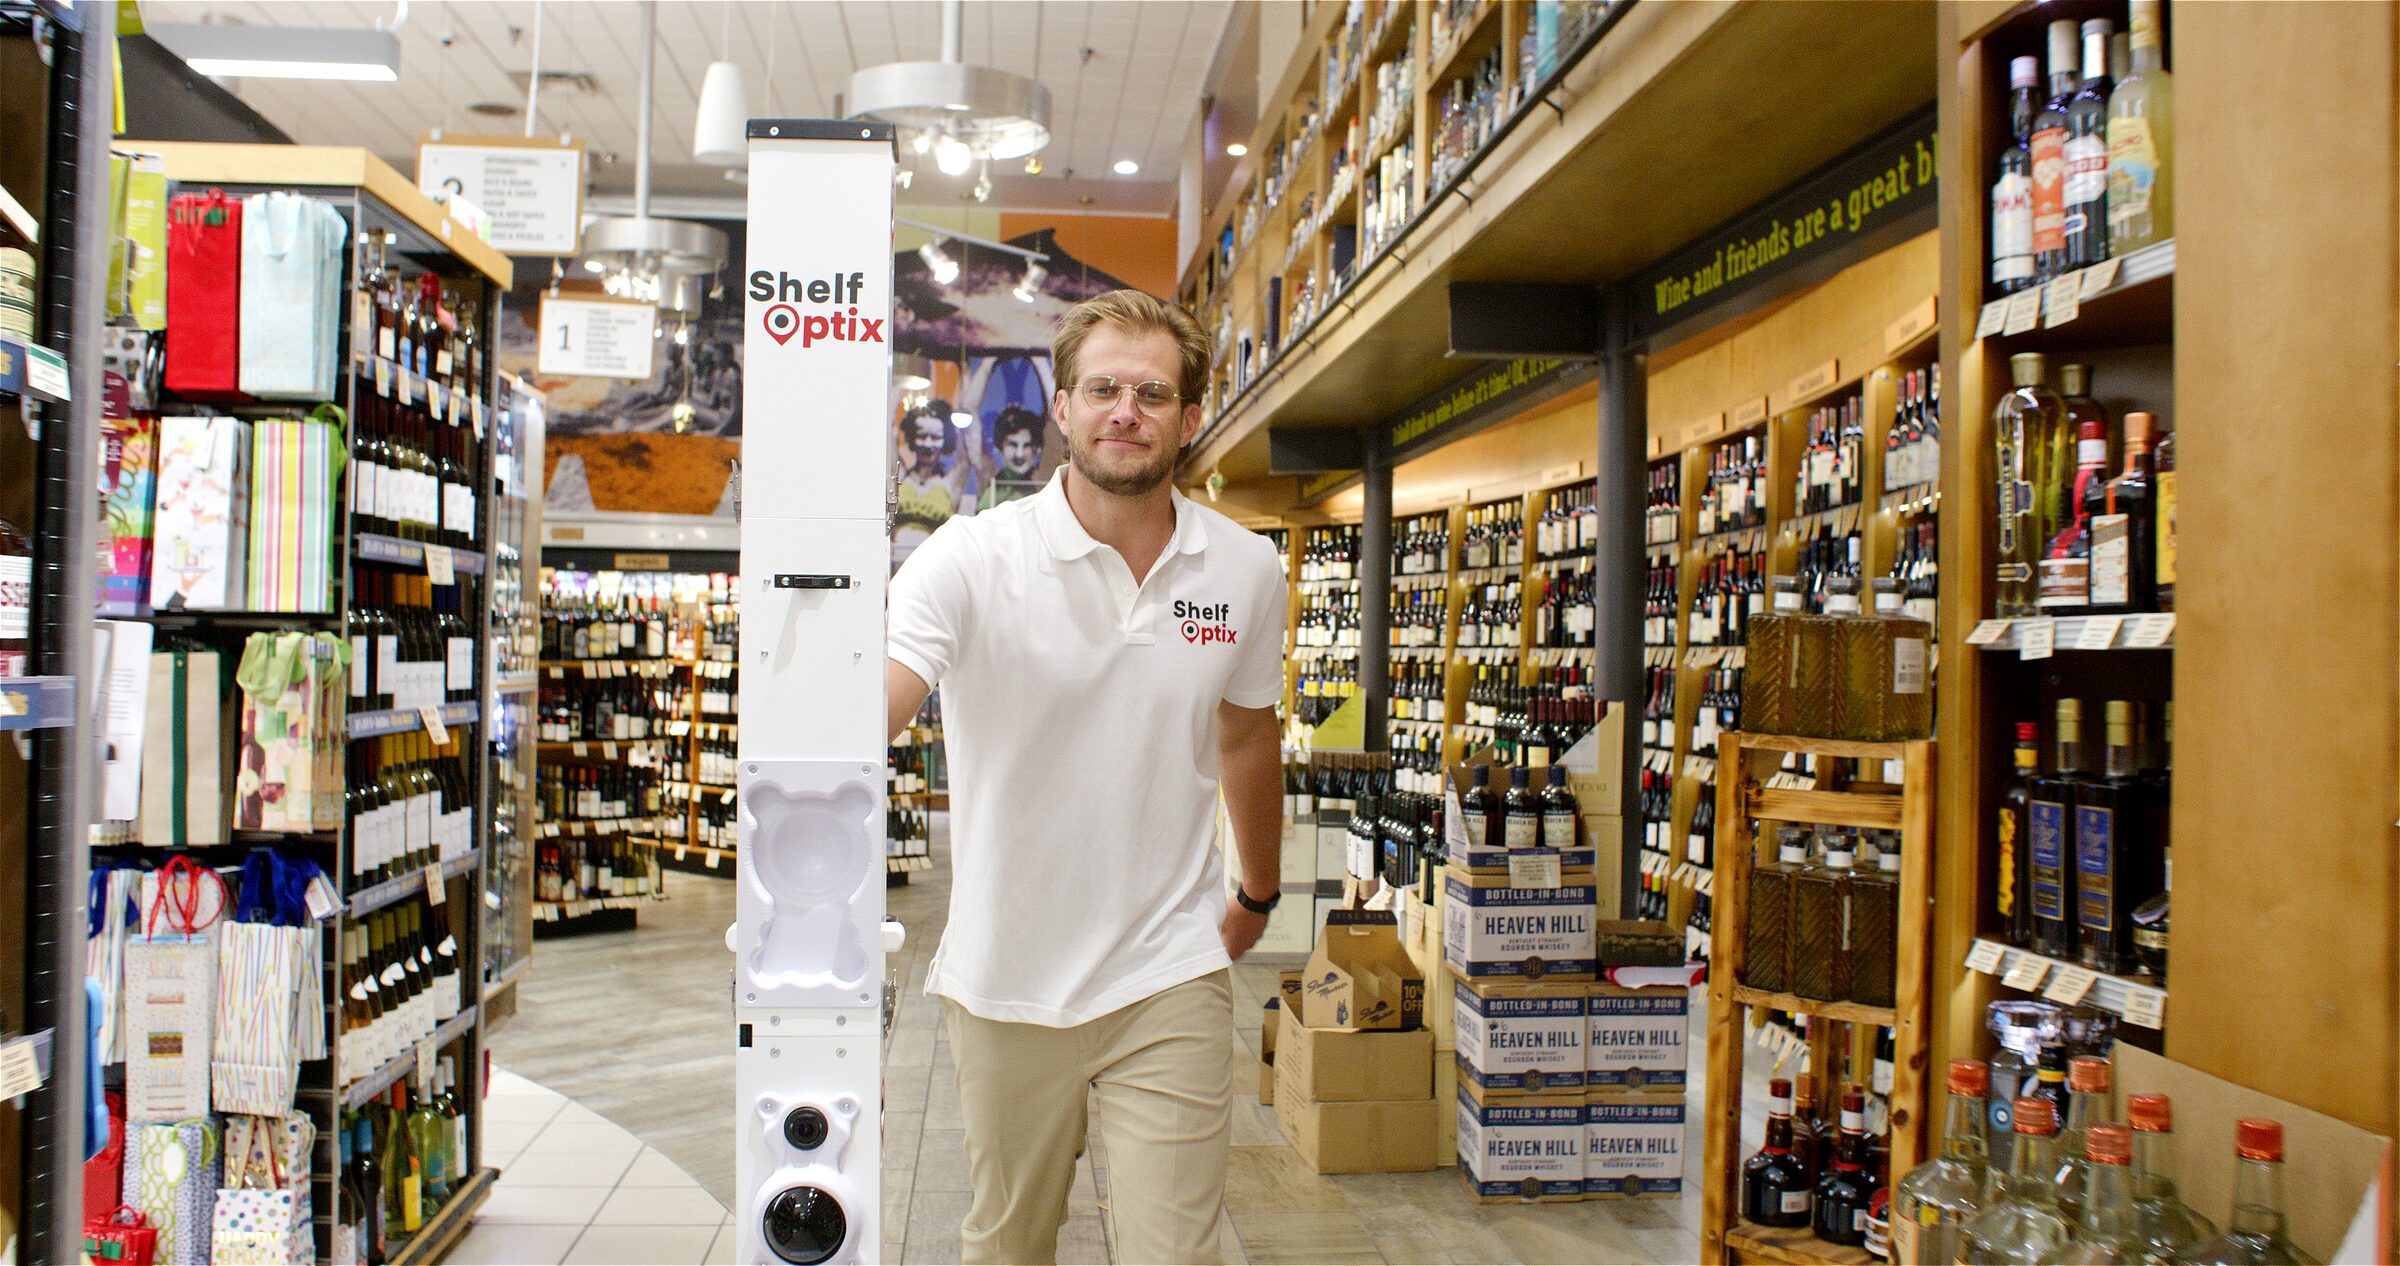
ShelfOptix does not sell tags, cameras, locks, or guards, and it does not detect or deter theft. It scans your shelves on a managed schedule with a human-escorted robot and reports where the shelf and the inventory record disagree. That comparison separates record errors from physical loss, which is the split you need before you spend on any tool in this guide.
If your split points to gaps between the shelf and the record, use How to Evaluate a Shelf-Intelligence Vendor to compare providers. If it points to theft, the matrix above shows where to look instead.
Split your shrink into its four causes first: external theft, employee theft, process and administrative error, and vendor fraud or error. Then match a tool or routine to each cause. Receiving checks, cause codes, waste logging, and frequent counts act on process and vendor error. Protective fixtures, self-checkout controls, and video act on theft. Pilot each change in test stores against matched control stores and measure count variance by cause, not the storewide shrink rate alone.
Retailers use eight main tool types: EAS tags and exit gates, CCTV and AI video, item-level RFID, POS exception reporting, locked cases and protective fixtures, receiving and DSD checks, cycle counting, and shelf scanning. The first five are sold mostly against theft. Receiving checks, cycle counting, and shelf scanning find process and vendor errors, which theft tools cannot see. RFID sits in both groups but works best on the record.
RFID improves the inventory record more than it reduces theft. In a 2018 ECR Retail Loss study of 10 retailers, inventory accuracy rose from about 65% to 75% before RFID to 93% to 99% after it. Few of the companies saw RFID as an effective way to reduce stock loss, because tags are easy to remove and exit readers were unreliable. RFID helps most with receiving errors and record drift.
Only in a narrow case. AI cameras at self-checkout flag items that pass without a scan, and some of those missed scans are honest errors. ECR Retail Loss found missed scans in 1% to 4.8% of self-checkout transactions in its 2026 study. Cameras cannot count cartons at the receiving dock, catch a wrong pack size, or correct the inventory record. Those errors need receiving checks, counts, and shelf-to-record comparison.
A shrink action plan needs five parts. First, a split of shrink by cause, by store and department. Second, a ranking of causes by dollars. Third, a tool or routine matched to each cause, starting with process and vendor gaps. Fourth, one named owner per cause across asset protection, store operations, and receiving. Fifth, a test-and-control pilot that measures count variance by cause code alongside sales.
ShelfOptix scans your shelves on a managed schedule and shows you where the shelf and your record disagree, so you know which part of your shrink is a record error before you buy a theft tool. Talk to the team about your count variance.
Thanks for reaching out. A member of the ShelfOptix™ team will be in touch with you right away.