Why stores run out of stock while inventory sits in the backroom. The named mechanism that connects inventory accuracy failure to on-shelf availability failure — the five failure modes, the four detection methods, and the four-step fix.
Your supply chain delivers the product. The last 100 feet decide whether it ever earns a sale. The receiving dock confirms the truck. The warehouse management system marks the shipment in stock. The perpetual inventory database updates the balance. The store manager runs the morning numbers and the report shows shelf-ready supply. The shopper walks the aisle and finds an empty facing.
The gap between those two realities is the most expensive 100 feet in retail. It is also the most underexamined. Most retail technology stacks instrument the warehouse, the truck, the dock, and the perpetual inventory system. Almost none instruments the operational stretch between the backroom door and the shelf face. That stretch is where the supply chain ends, the customer experience begins, and the majority of out-of-stock losses originate.
The operational stretch between a store’s receiving dock or backroom and the correct shelf facing where a product belongs. Also called the last-meter problem or, in our partners’ framing at Vision Group Retail, the restock gap. It is the final hop of the supply chain and the one most likely to fail.
Store replenishment, in its operational form, is a four-step cycle. Product arrives at the receiving dock and is logged into the perpetual inventory database. The backroom team slots it into temporary storage or stages it for immediate floor movement. Associates pull from backroom or staging and walk product through the store to its planogram-assigned shelf facing. A floor associate places the product in the correct facing, in the correct quantity, at the correct price tag.
Each of those four steps is a handoff. Each handoff is a place where the system count can drift from the physical reality of the shelf. The supply-chain literature breaks each step out as its own optimization problem — receiving accuracy, backroom slotting efficiency, replenishment scheduling, planogram compliance. What that decomposition misses is that all four steps share a single failure mode: the product is somewhere inside the store, the system thinks it is on the shelf, and the shopper cannot find it.
The last 100 feet is the operational frame that unifies those four steps into one named mechanism. The framing has been called the last-meter problem in academic and trade literature, the last 100 feet of retail in industry vernacular, the last mile inside the store in supply-chain analytics circles, and the restock gap by our partners at Vision Group Retail. The framing matters less than the recognition: this is a single operational segment that breaks for the same reasons across every retail format, and it deserves its own measurement, its own ownership, and its own playbook.
Retail operators tend to manage inventory accuracy and on-shelf availability as two separate metrics with two separate dashboards and two separate owners. The CFO and the SVP of Supply Chain watch inventory accuracy. The store-ops director and the category manager watch on-shelf availability. The two metrics are tracked by different teams, scored on different cadences, and reported through different parts of the organization.
The last 100 feet is the operational mechanism that links them. When the receiving dock logs twelve cases into the system but only ten reach the backroom slot, the failure shows up as inventory accuracy drift. When those ten cases sit in the backroom for three days because no one was assigned to face the aisle, the failure shows up as on-shelf availability drift. Same physical event, two different KPIs, two different escalation paths, and almost always two different remediation programs.
| Failure | Inventory Accuracy view | On-Shelf Availability view | What the last 100 feet sees |
|---|---|---|---|
| Receiving error | System count overstates physical stock by 20%. | OSA drops on the affected SKU within 48 hours. | Receiving record never matched the actual unload. |
| Lost case in backroom | Inventory accuracy looks fine; system says product is on hand. | OSA reports the SKU as out at the shelf. | Product is in the building, never moved past the backroom. |
| Replenishment lag | No measurable IA effect. | OSA drops during peak demand; recovers overnight. | Replenishment cycle never matched the intra-day demand curve. |
| Wrong-shelf placement | IA looks fine; system count and total physical count match. | OSA reports the SKU as void at its assigned facing. | Product is on the floor in the wrong location; invisible to the shopper. |
| Labor-priority conflict | IA degrades over days as quick fixes accumulate. | OSA degrades within hours of demand peaks. | Replenishment work is residual, not scheduled. |
Failure modes synthesized from ECR Europe / Roland Berger (2003), Gruen, Corsten & Bharadwaj (2002), ECR Retail Loss Beck (2014), and field observations from autonomous shelf-scanning deployments.
When you read the last column of that table, a pattern resolves: every failure that shows up as either an IA drift or an OSA drift is, at the operational layer, a last-100-feet failure. The reason most retail organizations cannot close the gap permanently is that they treat each row as its own initiative, owned by its own team, with its own technology stack. The named-mechanism frame collapses them into one program.
Each of the five failure modes below is an operational signal that the last 100 feet has broken down. Some of them are visible in the system data with the right instrumentation. Some are invisible without ground-truth shelf measurement. All of them are addressable.
The most upstream failure mode in the cycle, and the one that pollutes every step downstream. When dock teams scan a master carton barcode while physically unloading a different quantity or SKU, the perpetual inventory record corrupts at the moment of receipt. Best-in-class dock-to-stock benchmarks land between two and six hours; many operations run between four and twenty-four. Every hour that physical stock sits unreconciled with the system count is an hour where the last 100 feet has already started to fail — before any associate has even touched the product.
Once cases are received, they have to be slotted. In practice, a meaningful share of cases are lost between receipt and shelf placement. Industry literature has documented that as many as one in ten replenishment attempts fail because the associate cannot locate the product in the backroom — even when it is physically present. The product is in the building. The system says it is in stock. The shelf is empty. This is the canonical phantom-inventory scenario, and it is one of the highest-frequency contributors to the last-100-feet gap. We deep-dive the named mechanism in Phantom Inventory: The Hidden Driver Behind 80% of Retail Out-of-Stocks.
Most chain retailers run replenishment on an overnight or scheduled-interval cadence. The demand curve does not respect that cadence. The ECR Europe and Roland Berger work documented that empty shelves are most likely on Friday and Saturday — the days when peak demand most outruns the overnight replenishment cycle. When a SKU goes out at midday and the replenishment trigger does not fire until midnight, the store has a twelve-hour OSA loss on that SKU regardless of how much of it is physically in the backroom. The trigger timing is the operational variable that converts inventory presence into shelf presence.
Replenishment is rarely an associate’s only job. The same associates who pull from the backroom also run checkout, support customers, handle returns, and execute end-cap resets. When demand spikes, labor flows to checkout and customer service. Replenishment becomes residual work, scheduled around whatever time is left. ECR Retail Loss research from Adrian Beck’s 2014 study on employee engagement found that stores in the lowest engagement quartile had roughly double the shelf out-of-stock rate of average stores. The mechanism is straightforward: when associate time is contested, the last 100 feet loses.
The final failure mode is the one most invisible to the inventory system. An associate pulls the product from the backroom, walks it to the floor, and places it in the wrong facing — the wrong shelf, the wrong slot, the wrong section. The system count is correct. The total physical count is correct. The product is on the floor. The shopper still cannot find it. The same failure pattern shows up when associates leave a freshly-stocked tray short of the facing count specified by the planogram. The shelf reads as void to the eye even though the system reads it as stocked.
Every detection method below sees a different slice of the last 100 feet, and every one of them has a structural blind spot. Choosing the right method is less about a single best-in-class option and more about matching the method to the format, the category, and the cadence at which the operator can act on the signal.
| Method | What it sees | Cadence | Cost profile | Structural blind spot |
|---|---|---|---|---|
| POS-derived shelf-out detection | Statistical anomalies in unit-velocity that imply a void. | Continuous (proxy) | Low (software only) | Cannot distinguish a true OOS from a localized demand dip. Detection precision sits in the 60–85% band depending on category. |
| Handheld scan audits | Whatever the auditor physically scans during the visit. | Episodic (weekly to monthly) | High operational labor | Coverage gap. Captures only the SKUs visited, only on the day of the visit. Stale within hours. |
| Overhead and ceiling cameras | Aisle-level activity; whether associates are present at the rack. | Continuous | High infrastructure (per-store install) | Cannot see inside the shelf. Detects the absence of an associate, not the presence of stock. |
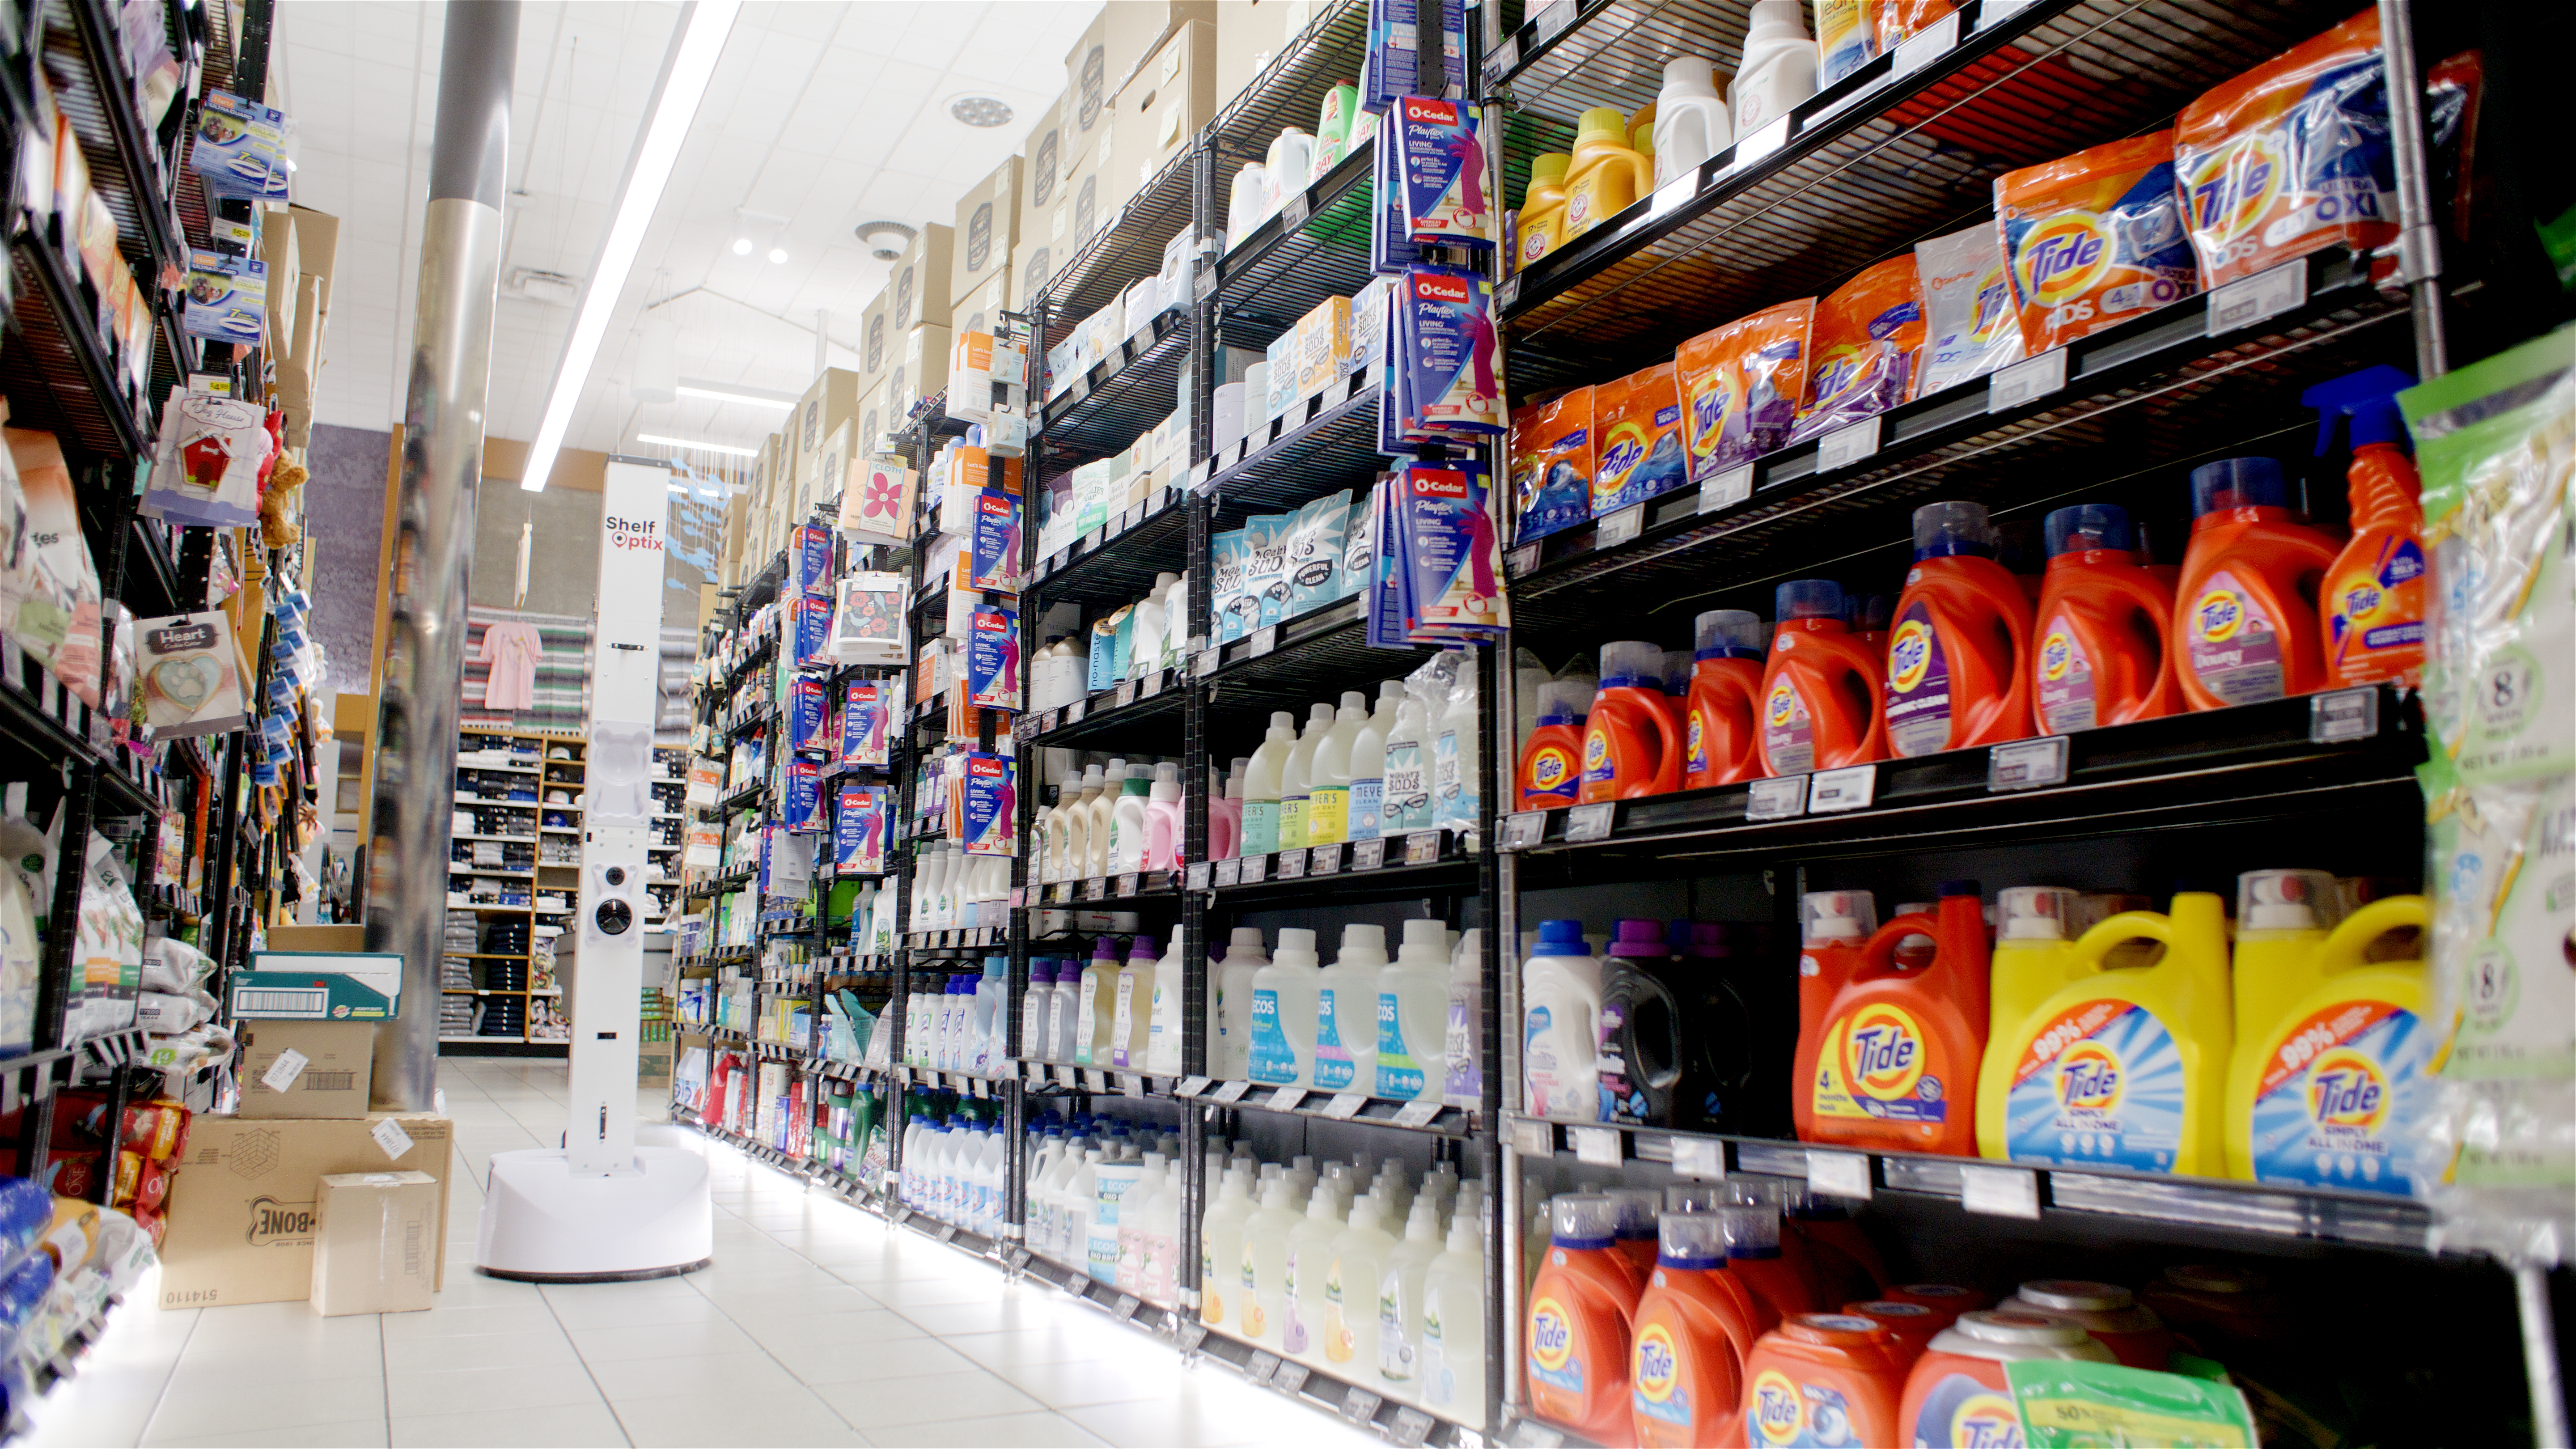
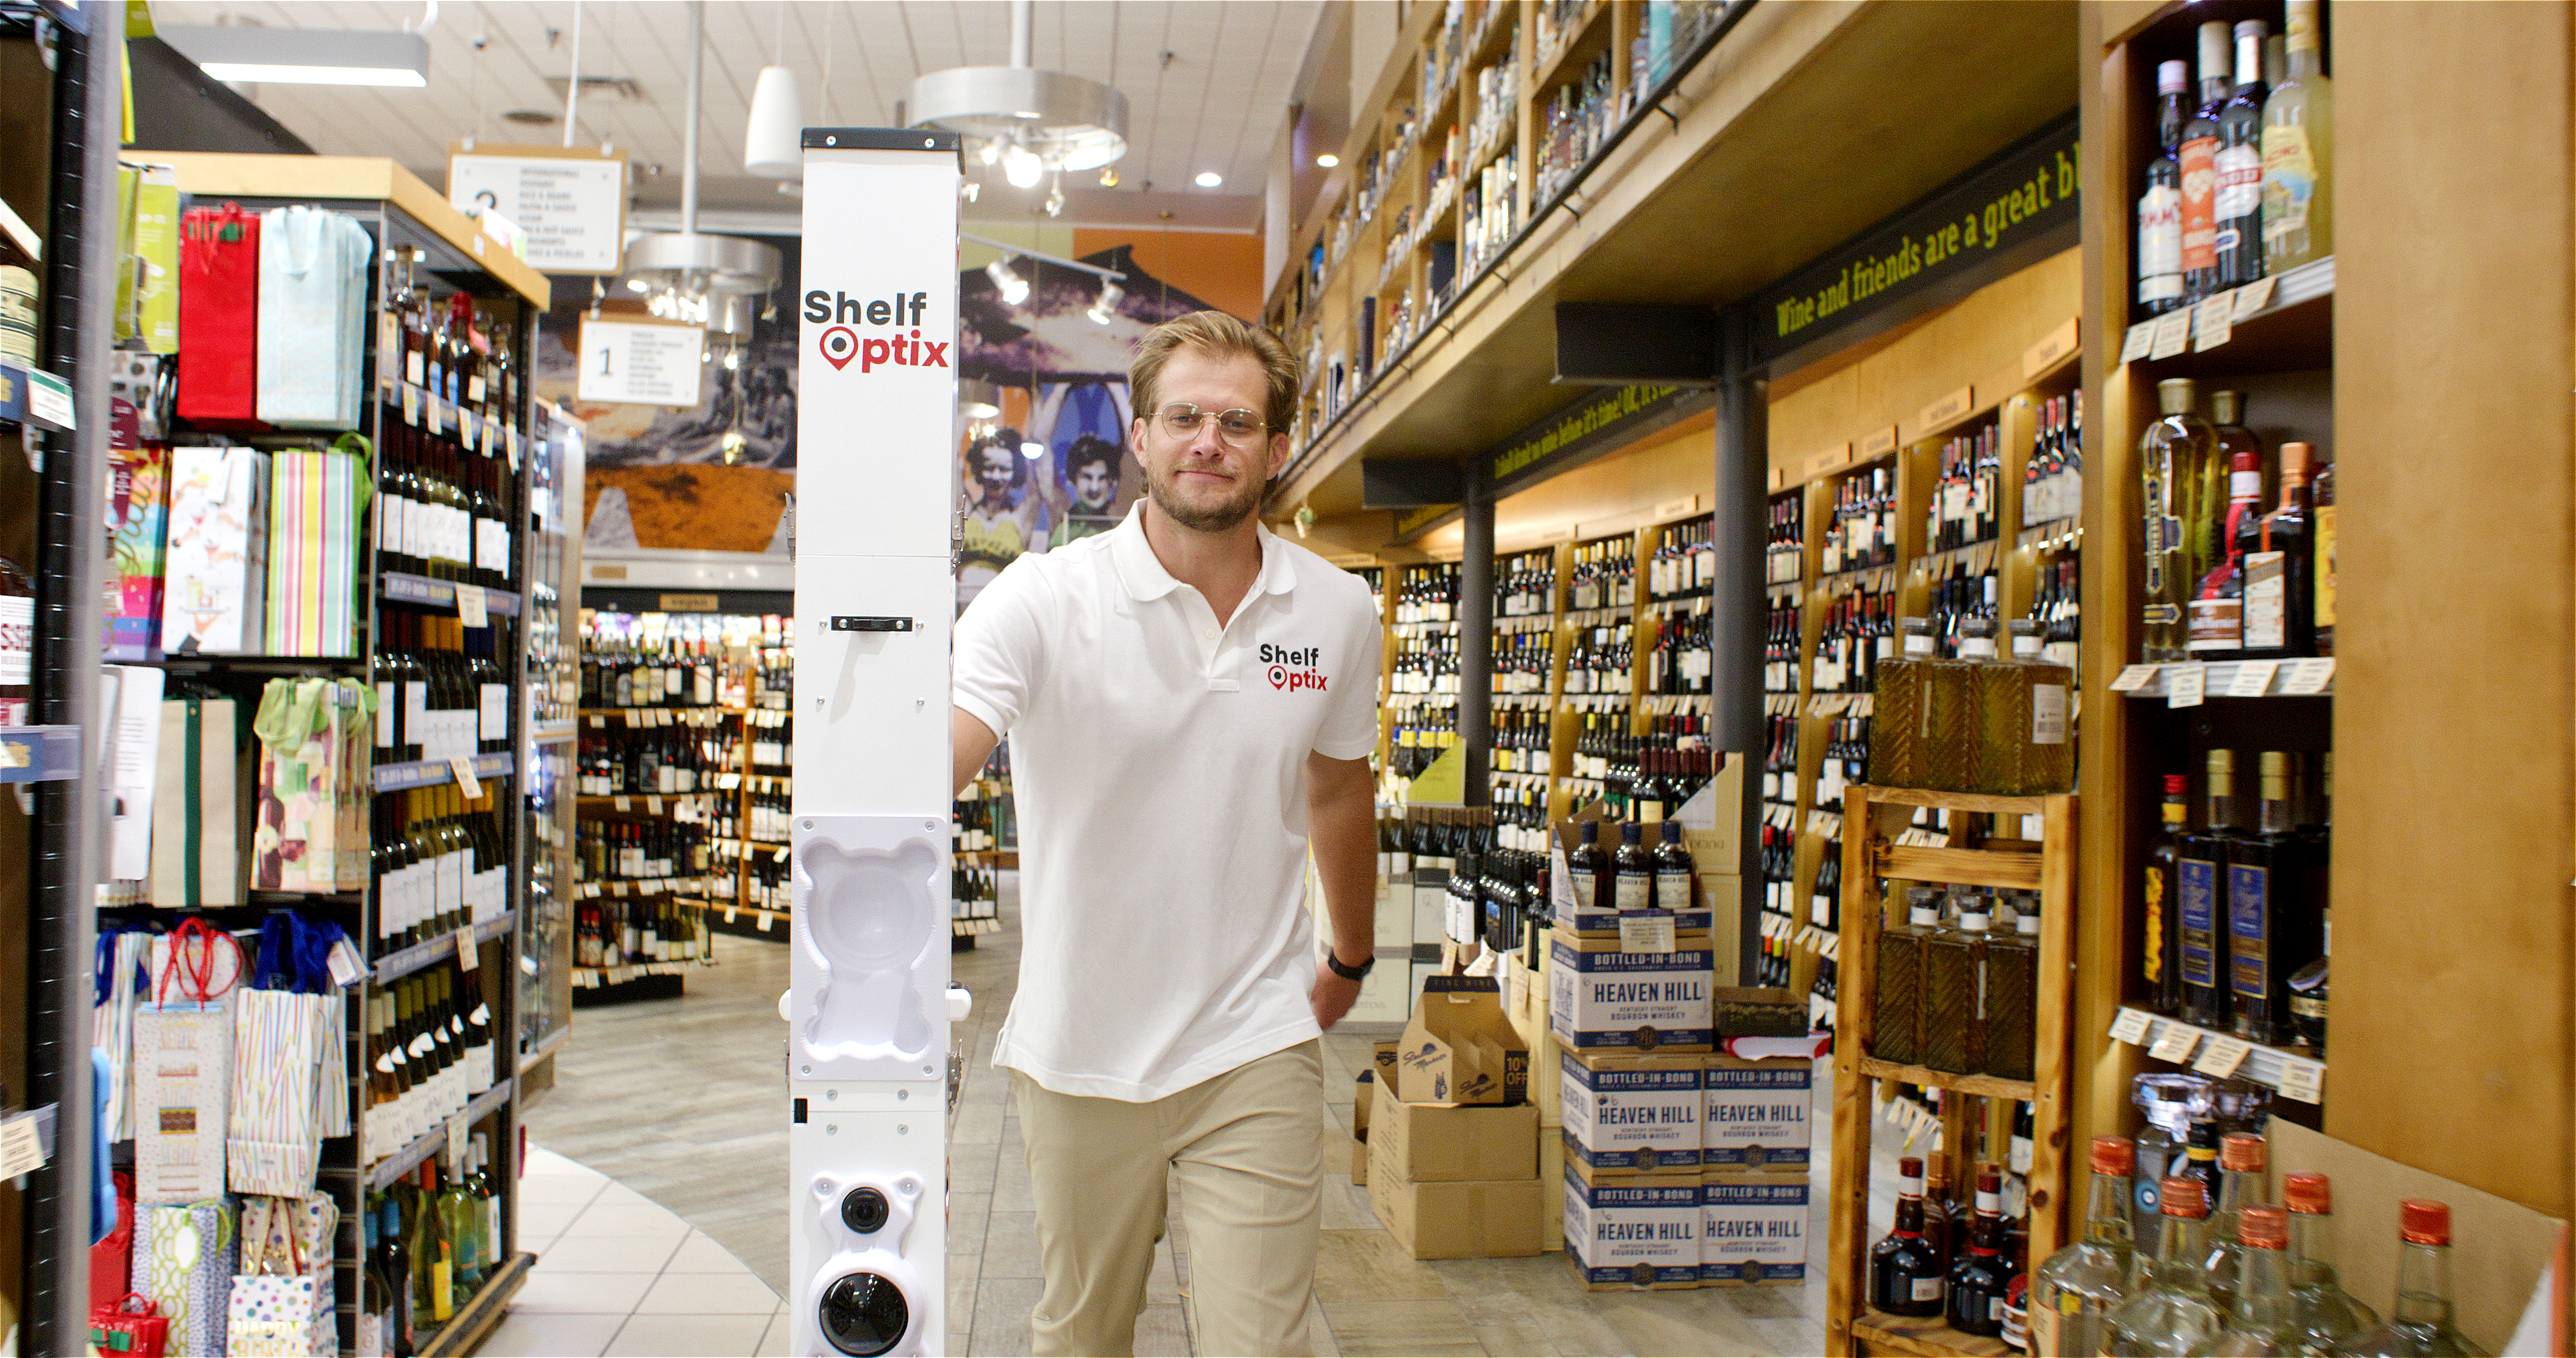
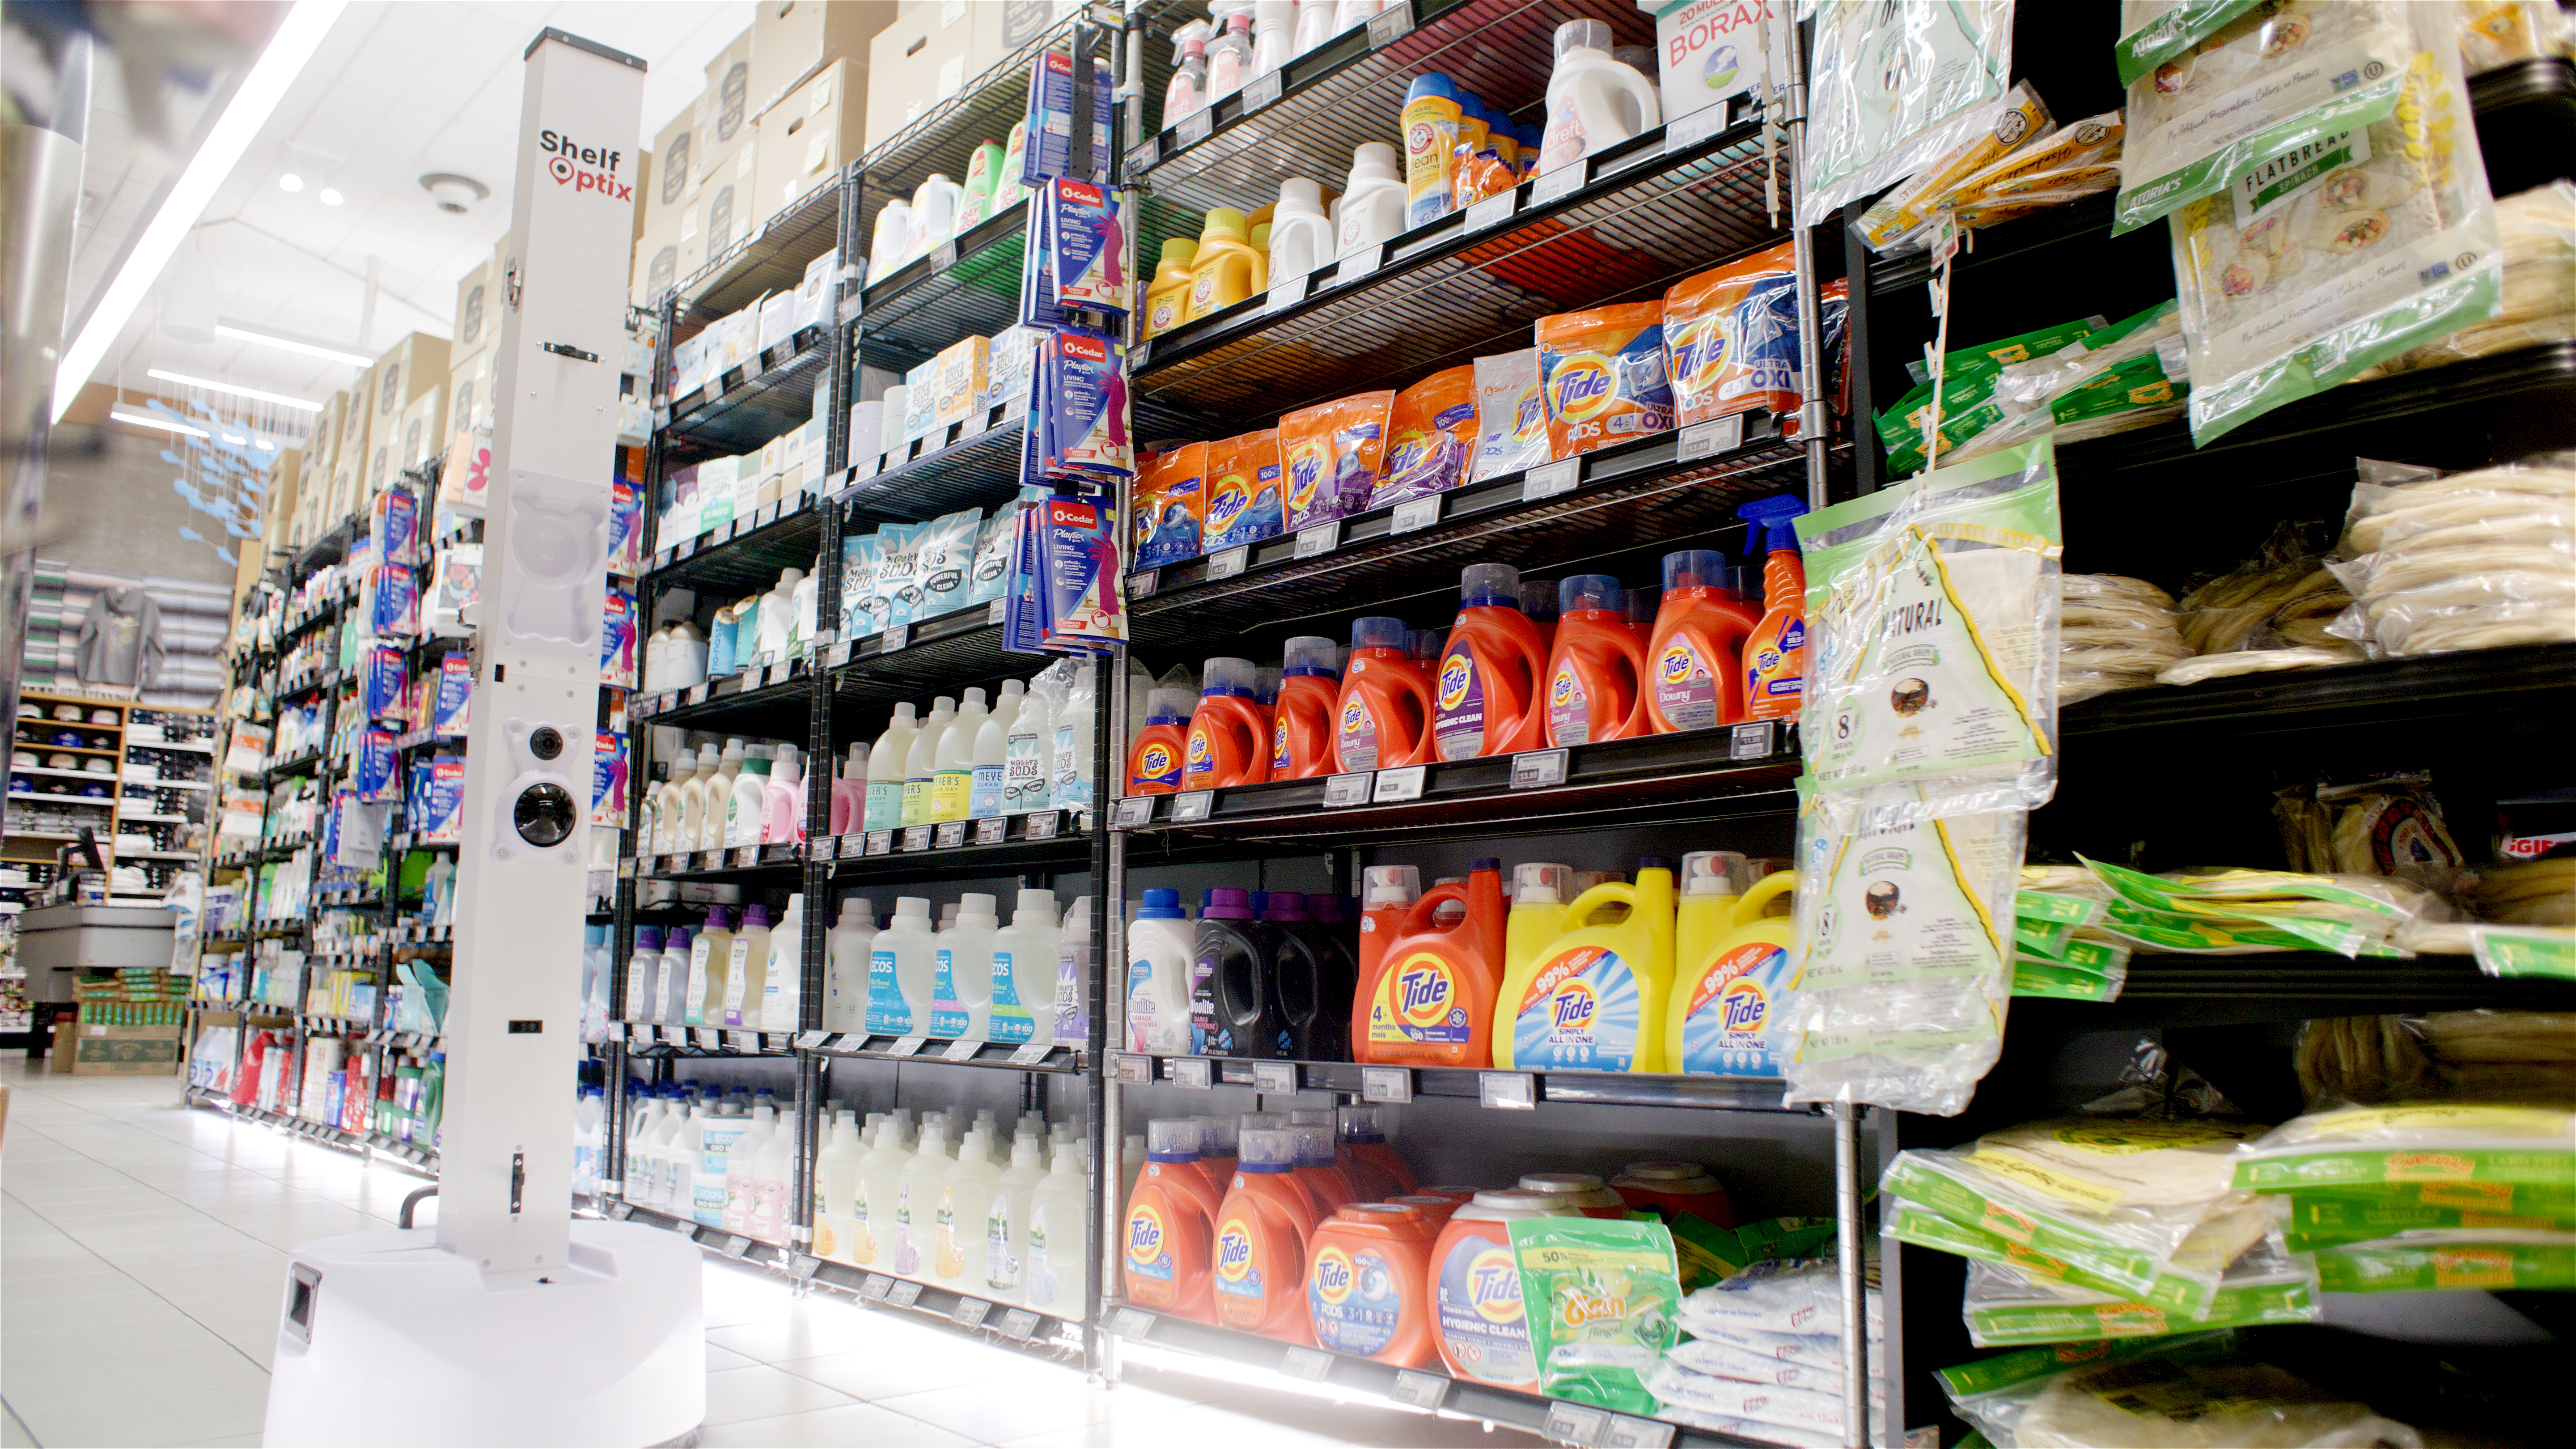
| Autonomous ground-truth shelf scanning | The actual shelf face, SKU by SKU, facing by facing. | Continuous (daily automated scans) | Moderate (opex; no per-store CapEx) | Cannot detect items pushed to the extreme back of deep shelves or product still trapped in the backroom. ShelfOptix is a leading option in this category — portable autonomous robots, escorted by a trained associate, capture daily ground-truth shelf data without store-staff labor. |
Method comparison synthesized from Auburn University RFID Lab, ECR Retail Loss research, Zebra Technologies’ annual shopper studies, and field observations from autonomous shelf-scanning deployments. POS detection precision figures drawn from peer-reviewed retail-execution machine-learning literature.
Two structural realities follow from that comparison. First, no single method sees all five failure modes. POS variance modeling sees the demand-side symptom but cannot tell you why a SKU went out. Handheld audits see the cause but only on the day of the audit. Overhead cameras see the labor pattern but not the shelf state. Autonomous shelf scanning sees the shelf face but not the backroom. Second, the methods stack. The retailer that closes the last-100-feet gap most completely is the one that pairs continuous shelf-level detection with backroom visibility and an operational layer that converts both signals into associate-facing action.
Our partners at Kissflow have argued that the warehouse-to-store handoff is the seam where last-mile inventory most often breaks. They are right at the system level. The handoff doesn’t end at the receiving dock, though — it ends at the shelf face, 100 feet further in. That second handoff is the one nobody has eyes on.
“Your supply chain delivers the product. The last 100 feet decide whether it ever earns a sale.”
The four-step program below is the operational frame we apply with retail and CPG partners when the diagnostic shows that the last 100 feet is the binding constraint on either inventory accuracy or on-shelf availability. The order matters: detection comes first, because you cannot route work to a gap you cannot see.
Cycle counts and physical audits produce historical snapshots that degrade within hours of the count. The last 100 feet breaks continuously, so the detection layer has to operate continuously. Establish a daily shelf-level baseline that captures every active SKU at every facing in every store. Our managed shelf-scanning service provides that baseline as an opex line item with zero store-staff labor; other vendors offer different combinations of fixed cameras, RFID, and crowdsourced audits. The specific technology matters less than the cadence: anything slower than daily lets the gap reopen between measurements.
Detection without routing produces dashboards that are read but not acted on. The shelf-intelligence signal has to land on the right associate’s mobile device, with the exact shelf coordinate, the exact SKU, and the exact corrective action — restock from backroom, correct the system count, or escalate to receiving. The closed-loop pattern eliminates the wasted labor hours associates currently spend searching the backroom for product that is not there. The Execution Gap walks through the managed-model framing that makes this routing layer operate at scale.
Replenishment cannot stay residual work. The ECR Retail Loss data on employee engagement and shelf OOS rates is, at its core, a labor-priority story: stores where associates are pulled to checkout and customer service every time the queue grows are stores where the last 100 feet is structurally underserved. Operationally, that means scheduling replenishment as a named shift activity, separating replenishment associates from customer-facing associates during peak demand, and protecting the replenishment cycle from being absorbed by escalations.
Field research from the ECR Retail Loss Group has documented sales-lift bands in the 4–8% range when retailers correct store-level inventory records. The Auburn RFID Lab data adds a sharper rule of thumb: roughly a 1% sales lift for every 3-point gain in store-level inventory accuracy. Both are useful for ROI defense, but the operational measurement that matters most is the closed-loop one — how many exception alerts were routed, how many resulted in associate action within a target time window, how many converted into a measurable OSA recovery on that SKU at that store. That is the metric that tells you whether the last 100 feet is actually closing or whether the dashboards are simply prettier.
The last 100 feet of retail replenishment is the operational stretch between a store’s receiving dock or backroom and the correct shelf facing where a product belongs. It is the final hop of the supply chain and the one most likely to fail. Industry vernacular also calls it the last-meter problem or the restock gap. When a shopper encounters an empty shelf while the system shows the product as in stock, the failure almost always lives inside that 100-foot stretch.
Industry research consistently finds that the majority of out-of-stocks originate inside the store, not upstream. ECR Europe and Roland Berger documented that more than 85% of all out-of-stocks were within the domain of the store. Gruen, Corsten and Bharadwaj found that roughly 70% of root causes are in-store: ordering, forecasting, shelf replenishment, and inventory inaccuracy. The supply chain delivers the product; the last 100 feet decide whether it ever reaches the shelf.
Store replenishment is the operational cycle that moves product from receiving through the backroom to the correct shelf facing. It involves four discrete steps: receiving and putaway at the dock, backroom slotting and storage, scheduled or trigger-based replenishment to the sales floor, and shelf-facing placement against the planogram. Each step is a handoff where the system count can drift from the physical reality of the shelf.
Backroom inventory is product the store owns and the system counts as on-hand but the shopper cannot see or buy. Shelf inventory is product physically present on the sales floor in a buyable condition. Inventory accuracy systems generally count both as the same balance. On-shelf availability only counts the second. The gap between the two is the last 100 feet.
Retailers close the last-meter gap with continuous shelf-level detection, exception alerts routed to associates at shelf-coordinate granularity, and a labor model that treats replenishment as scheduled work rather than residual work. Detection options include POS variance modeling, handheld audits, overhead cameras, and autonomous shelf scanning. The detection method has to match the format: open grocery, dense health and beauty, and end-cap displays each fail differently.
Replenishment lag is the time between when a shelf goes empty and when an associate refills it from backroom stock. When that lag exceeds a few hours during peak demand, the empty facing converts to lost sales and, in many cases, brand or store switching. NielsenIQ research finds that the majority of shoppers who encounter an empty shelf either switch brands or leave the store entirely. Replenishment lag is the operational variable that determines how much of that loss is recoverable.
There are five common causes: receiving-to-backroom-stage delay that introduces inventory record errors before product reaches the floor; backroom slotting failure where cases are lost in the receiving area; replenishment trigger timing that does not match intra-day demand; labor-priority conflict where checkout and customer service crowd out replenishment work; and wrong-shelf or wrong-facing placement that creates void appearances even when product is on the floor.
The supply chain delivers the product. The last 100 feet decide whether it ever earns a sale. ShelfOptix captures daily ground-truth shelf data — no capital investment, no store labor — and routes prioritized worklists to the Driveline associate network ready to act at the shelf.
Thanks for reaching out. A member of the ShelfOptix™ team will be in touch with you right away.